

 Available in US
Content
- The Only Edge That Matters: Betting Where the Price Is Wrong
- Implied Probability: Converting Odds into Percentages
- The Overround: How Bookmaker Margin Eats Your Edge
- A Step-by-Step Method for Identifying Value Bets
- Where Value Hides: Match Result, BTTS, Totals
- Five Mistakes That Kill Value-Betting Profits
- FAQ
The Only Edge That Matters: Betting Where the Price Is Wrong
I once backed a League One side at 3.40 to win at home against a team two places above them in the table. A friend asked me if I’d lost my mind — the hosts hadn’t won in five. I told him I didn’t care about the recent results. What I cared about was that the hosts had generated 1.6 xG per home match over the previous twelve games while converting at a rate that suggested they’d been desperately unlucky. Their underlying numbers said they should have been winning. The price said nobody believed them. I did, and the 3.40 was wrong. They won 2-1.
That single bet illustrates the only concept that separates long-term winners from long-term losers: value. A value bet doesn’t mean backing a winner — it means backing an outcome at odds that overstate the true probability of that outcome not happening. Bookmaker margins on football markets typically sit between 4% and 7%, which means the odds you’re offered are systematically worse than fair. To profit consistently, you don’t need to be right more often than the market. You need to find spots where the market’s implied probability is lower than the true probability — and where that gap exceeds the margin built into the price. Every pound of that billion-plus in football betting yield represents the aggregate margin advantage bookmakers hold over the betting public.
Everything else — form analysis, xG, team news, head-to-head records — is just a toolkit for answering one question: is this price wrong? If the answer is no, you move on. If the answer is yes, and the degree of wrongness compensates for the bookmaker’s built-in advantage, you have a bet worth placing. This article walks through the mechanics of how to make that judgment with numbers rather than hunches.
Implied Probability: Converting Odds into Percentages
Before you can decide whether a price is wrong, you need to understand what that price is actually saying. Every set of odds contains a hidden probability — the bookmaker’s estimate, plus their margin, of how likely an outcome is. The first skill of value betting is learning to read that hidden message.
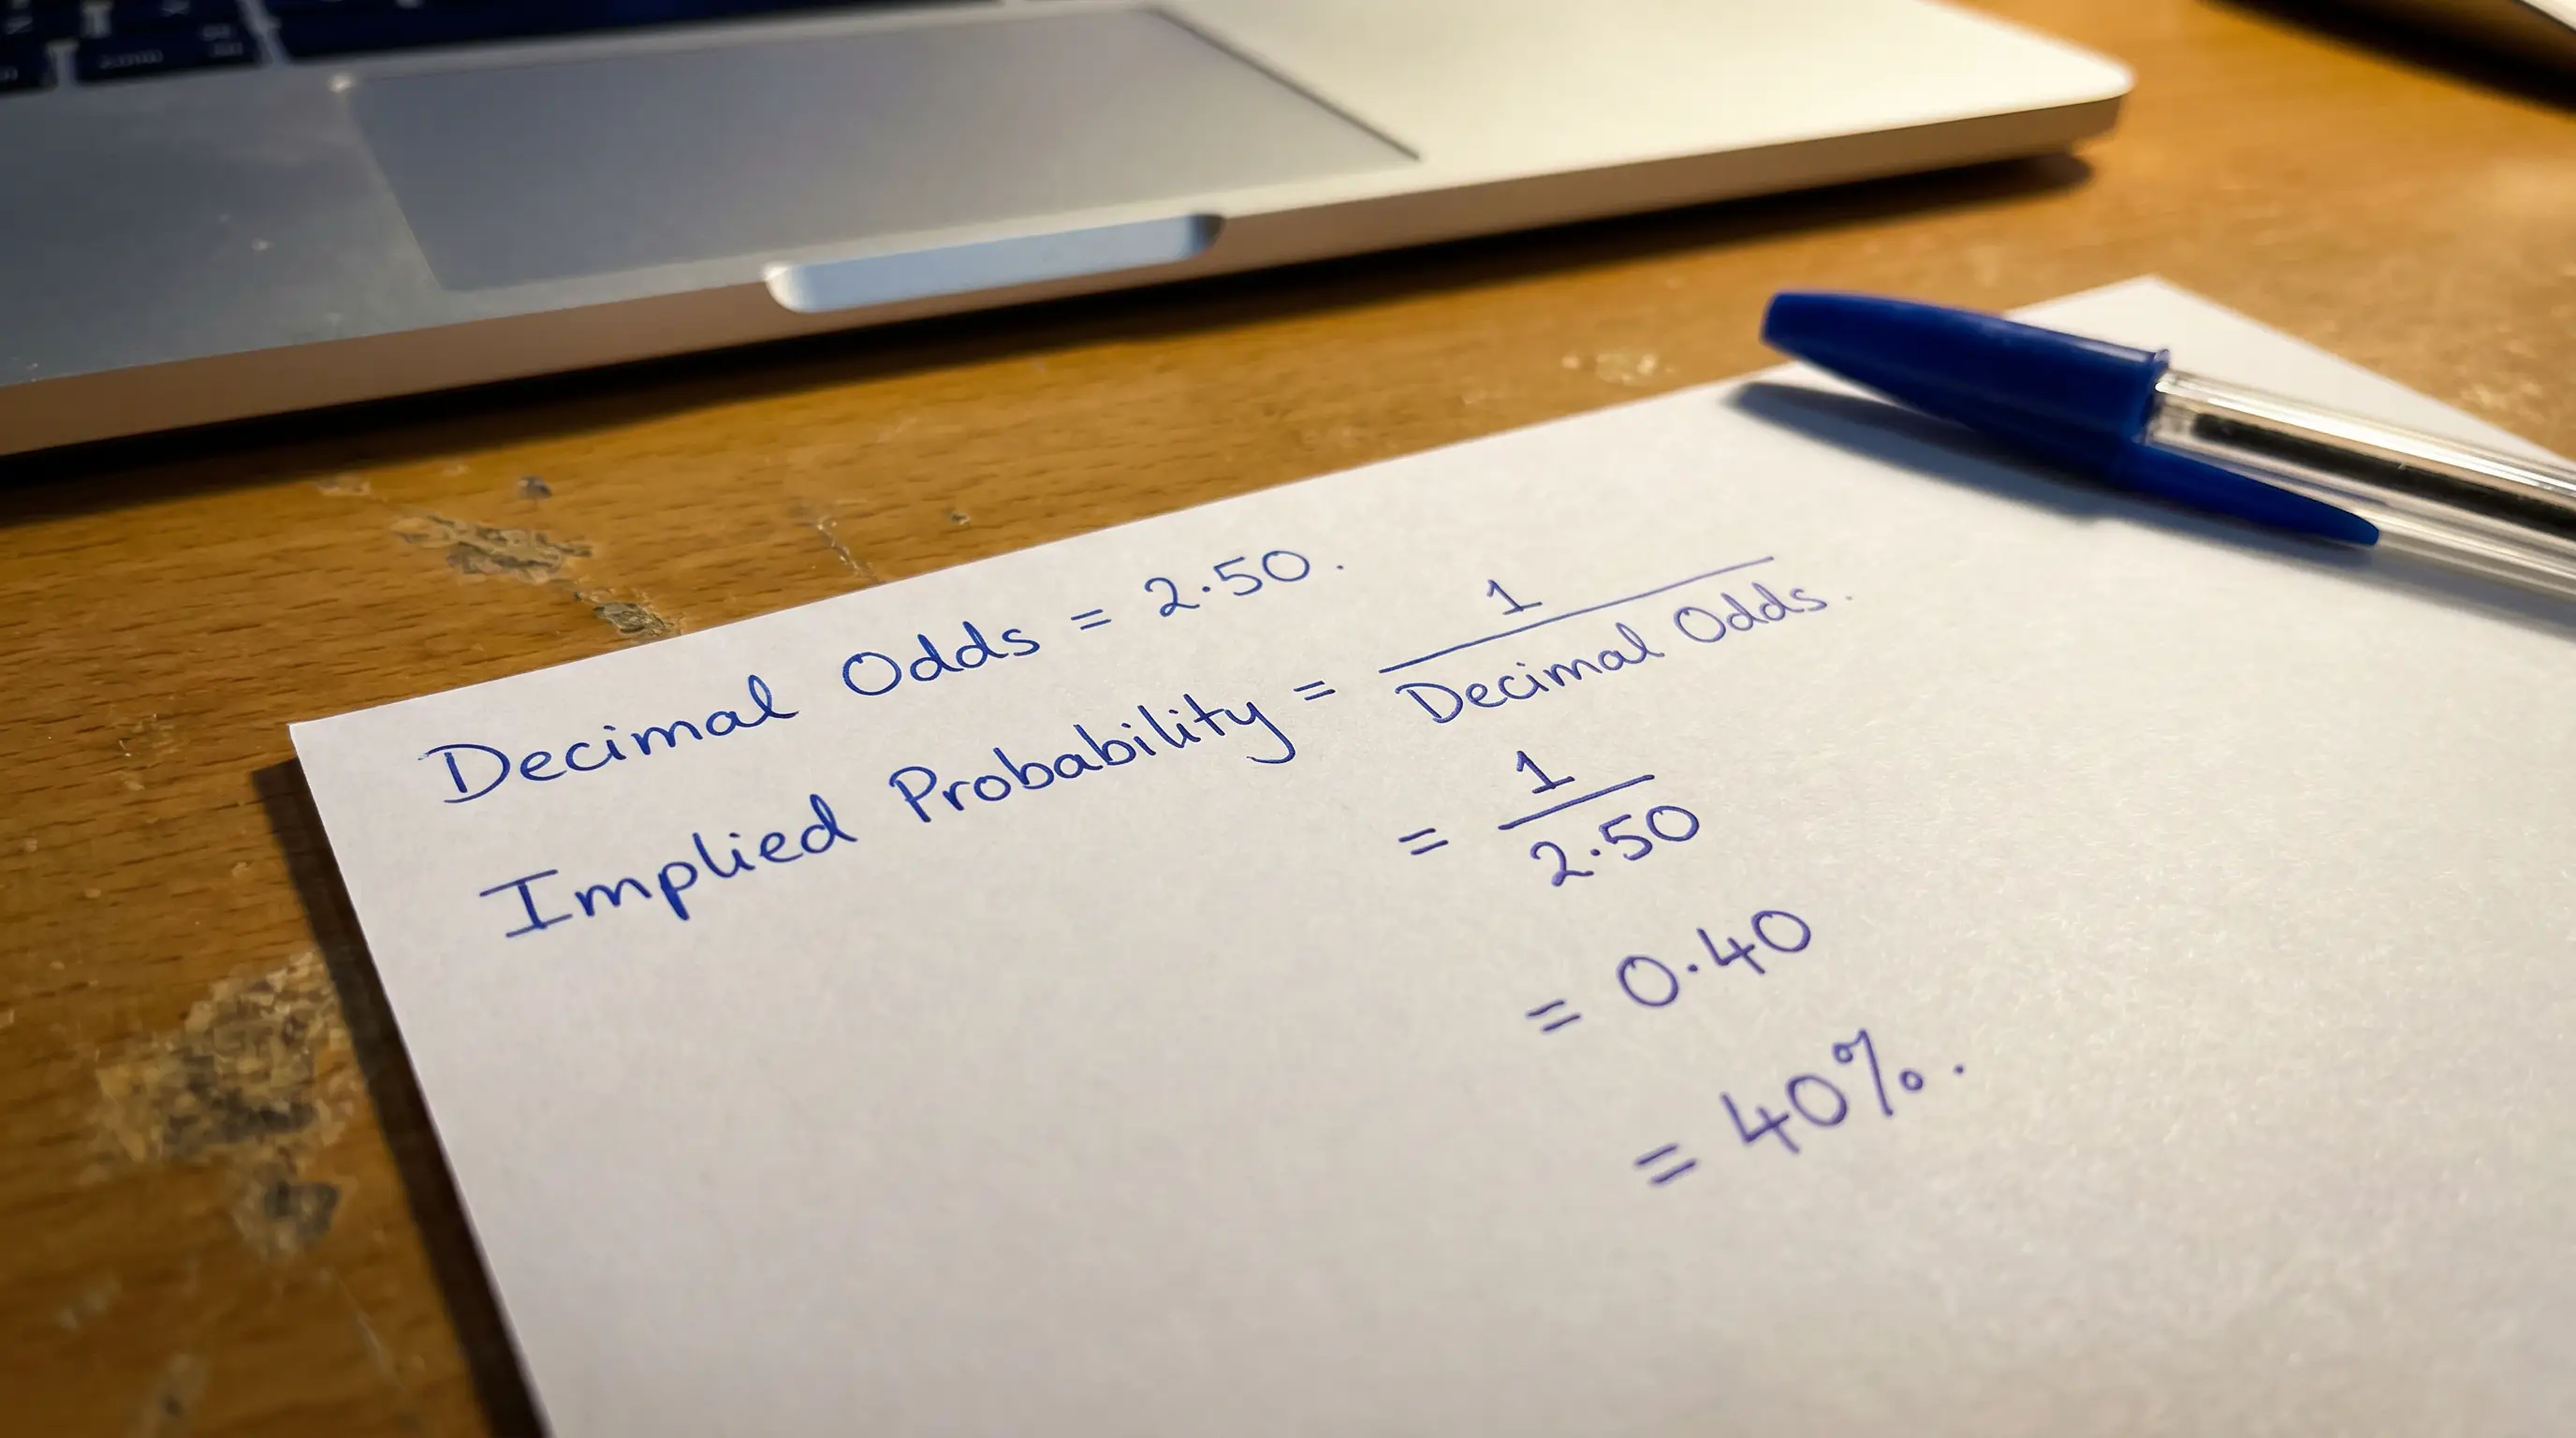
The conversion is simple. For decimal odds, divide 1 by the odds and multiply by 100 to get the implied probability as a percentage. Odds of 2.50 become 1 divided by 2.50, which equals 0.40, or 40%. Odds of 1.80 become 1 divided by 1.80, which equals 0.5556, or roughly 55.6%. Odds of 4.00 imply a 25% chance. Once you’ve done this a dozen times, you’ll start seeing probabilities rather than prices — and that shift in perception is worth more than any tipster subscription.
For fractional odds, which you’ll still encounter on UK betting sites, the formula is slightly different: divide the denominator by the sum of numerator and denominator. Odds of 6/4 become 4 divided by (6 plus 4), which equals 4 divided by 10, or 40%. Odds of 4/6 become 6 divided by 10, or 60%. If you find fractions cumbersome — and I do — most sites let you switch to decimals in your account settings. I made the switch years ago and never looked back.
Here’s a worked example using a real-world match structure. Suppose a Premier League fixture is priced at: home win 2.10, draw 3.40, away win 3.60. Converting each to implied probability gives you home win 47.6%, draw 29.4%, away win 27.8%. Add those up: 47.6 plus 29.4 plus 27.8 equals 104.8%. In a fair market, those three probabilities would sum to exactly 100%. The excess — 4.8% — is the bookmaker’s overround, their built-in profit margin. Every price you’re offered is slightly worse than fair, and understanding by how much is the entry ticket to value betting.
This isn’t abstract maths. It’s the language bookmakers speak. The sooner you become fluent in it, the sooner you stop thinking “2.10 feels about right” and start thinking “the market says 47.6% — do I agree?” That question, applied consistently across hundreds of bets, is the foundation of every profitable approach I’ve seen.
The Overround: How Bookmaker Margin Eats Your Edge
Think of the overround as a toll road. You can drive anywhere you like, but every journey costs a percentage of your fuel. Even if you pick the optimal route every time, the toll still applies — and if you don’t account for it, you’ll run out of fuel eventually without understanding why.
On a typical Premier League match result market, the overround sits around 4% to 5%. That means if you backed every possible outcome at the offered prices, you’d lose roughly 4% to 5% of your total outlay. On less liquid markets — correct score, first goalscorer, some lower-league fixtures — the overround can balloon to 10%, 15% or even higher. The more outcomes a market has, the easier it is for the bookmaker to hide margin across the prices without any single odds looking obviously short.
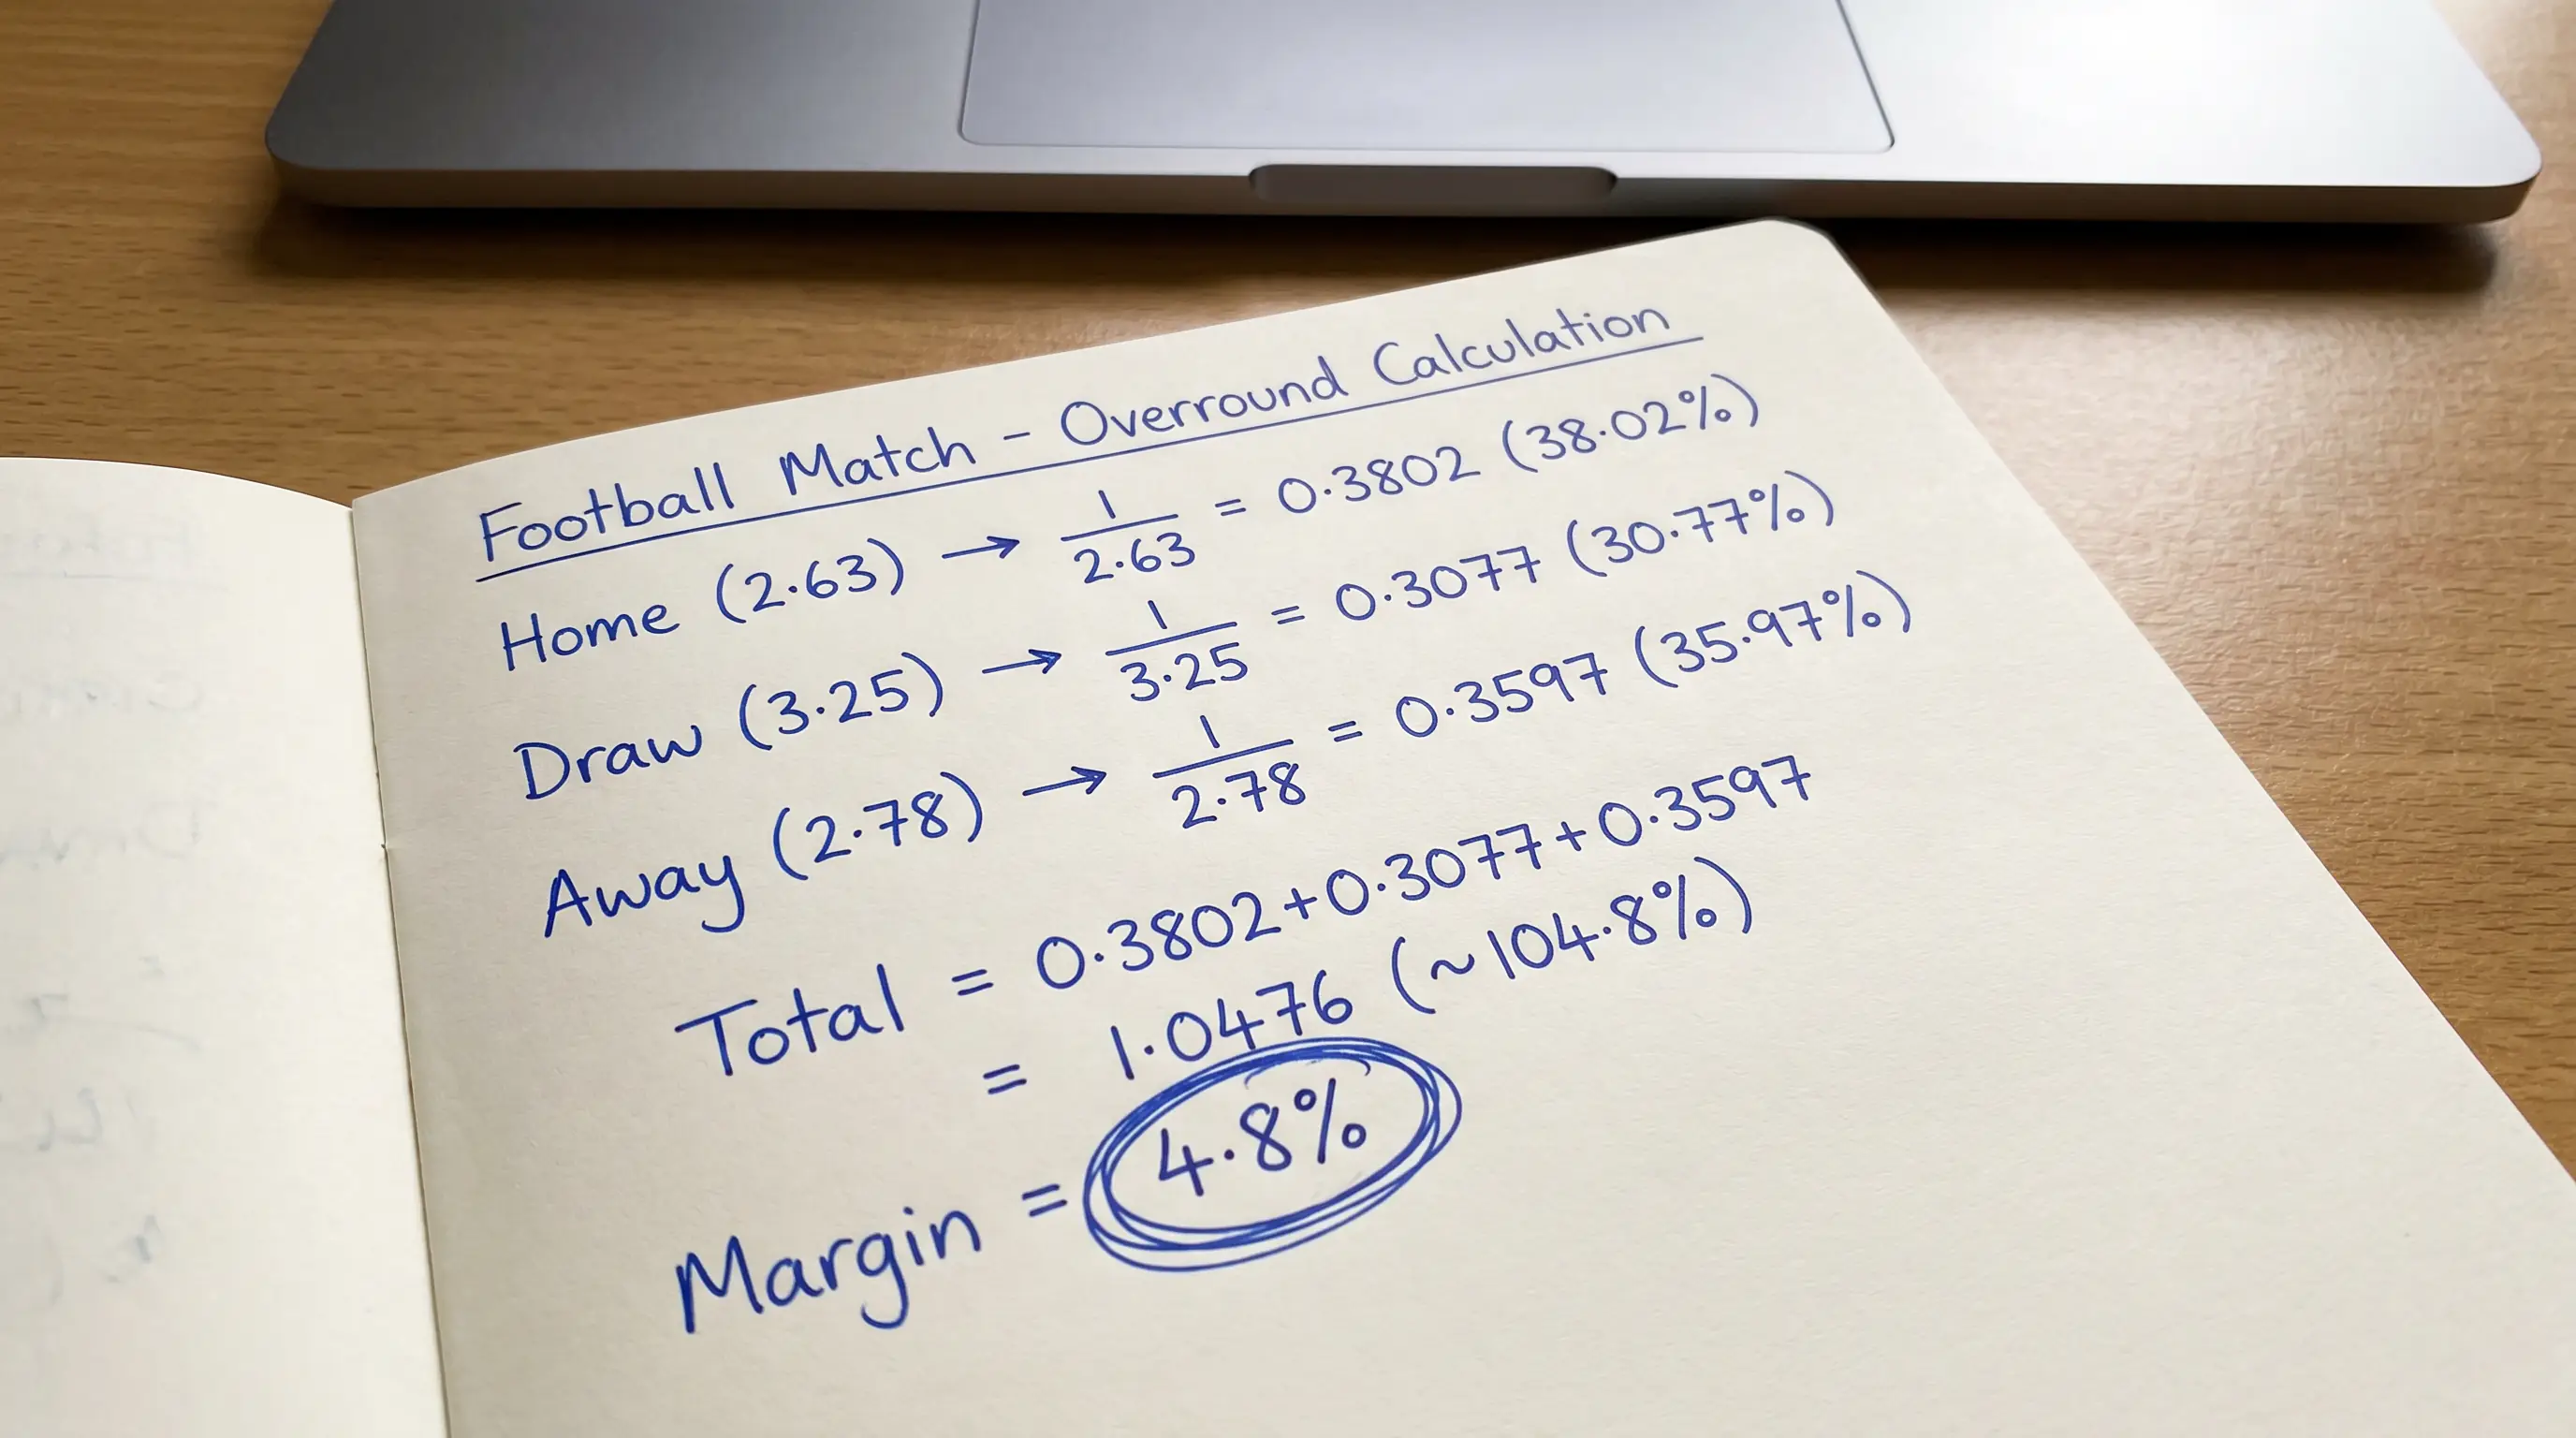
Calculating the overround for any match takes thirty seconds. Convert each outcome’s decimal odds to an implied probability using the formula from the previous section, then sum them. Subtract 100 from that total. The result is the bookmaker’s margin. For the example above — home 2.10, draw 3.40, away 3.60 — the sum was 104.8%, giving a margin of 4.8%. That’s moderate. A Champions League final might see margins as tight as 3%, because the volume of money flowing in forces competitive pricing. A League Two fixture on a Tuesday night might carry 7% or more.
Why does this matter for value betting? Because the overround defines the hurdle you need to clear. If the margin on a market is 5%, you need your true probability estimate to exceed the implied probability by more than 5% before you have a positive expected value bet. An edge of 2% on a 5% margin market isn’t an edge at all — it’s a slow loss.
I keep a running log of the overround on every market I bet into. Over a season, the data is striking: my yield is consistently higher on markets with lower margins, and consistently negative on high-margin markets where I thought I saw value but was really just overpaying for the privilege of being right. The full overround calculation method is worth learning properly — it takes the guesswork out of deciding which markets to target.
A Step-by-Step Method for Identifying Value Bets
When I first tried value betting, I made the classic mistake: I looked at a price, decided it “seemed too high” and called it value. That’s not analysis — it’s wishful thinking in a different outfit. Genuine value identification needs a structured method, and here’s the one I’ve refined over the years.
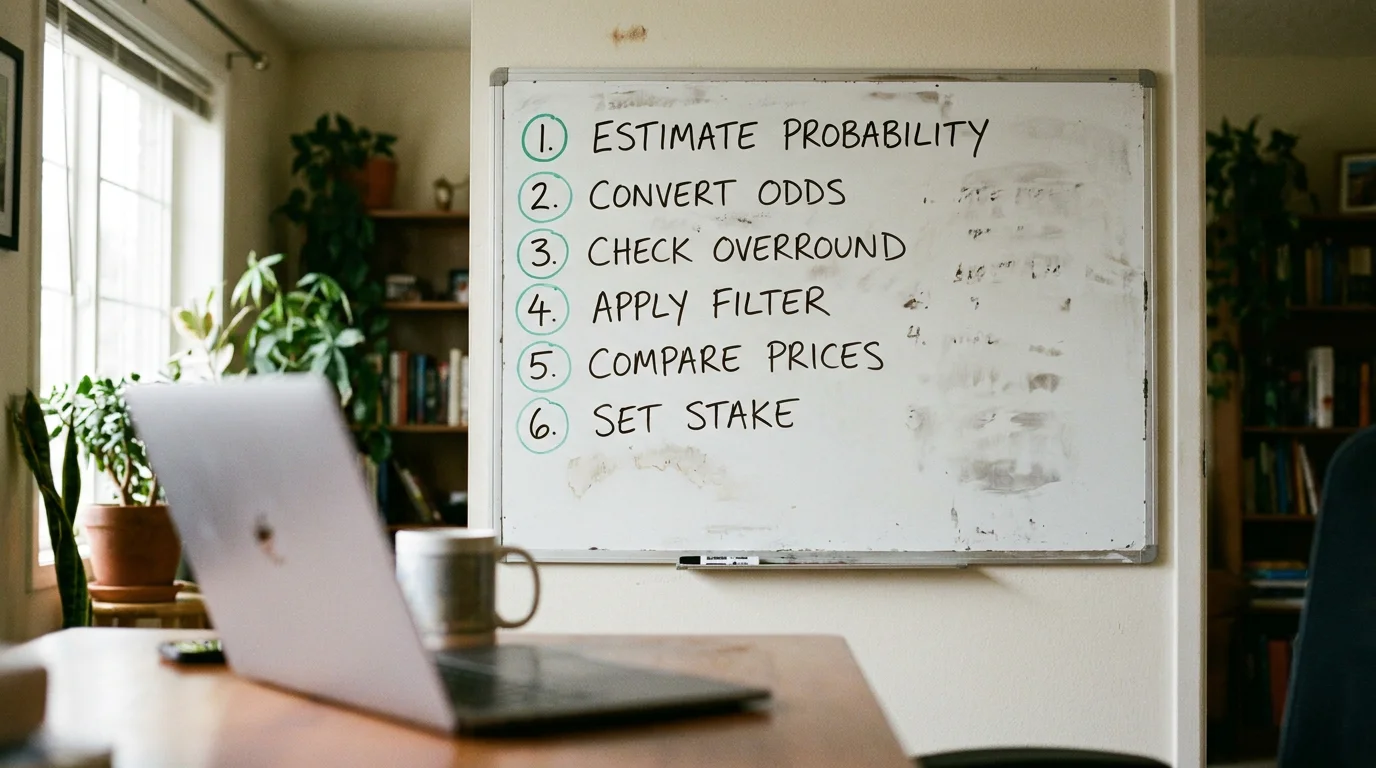
Step 1: Build your probability estimate independently. Analyse the fixture using form, xG, team news and situational context. Arrive at your own probability for each outcome before looking at the odds. If I’m assessing a match and I estimate the home side has a 52% chance of winning, that number needs to exist on paper before I open a bookmaker’s site. Anchoring to the market price first contaminates your judgment — it’s the single biggest methodological error in amateur value betting.
Step 2: Convert the bookmaker’s odds to implied probability. Home win at 2.00 implies 50%. My estimate says 52%. The raw gap is 2 percentage points.
Step 3: Adjust for the overround. If the market’s total implied probability is 105%, the true implied probability of that 2.00 price is closer to 50% divided by 1.05, which equals 47.6%. Now the gap between my estimate (52%) and the adjusted implied probability (47.6%) is 4.4 percentage points. That’s a meaningful edge.
Step 4: Apply a confidence filter. Not all edges are created equal. A 4.4% edge on a match I’ve analysed for thirty minutes using multiple data sources is worth acting on. A 4.4% edge on a match I glanced at for five minutes isn’t — because the uncertainty in my probability estimate is too wide. I only bet when the edge is large enough to survive the error margin in my analysis. In practice, that means I want at least a 3% gap after adjusting for the overround.
Step 5: Check the price across multiple bookmakers. Even if a bet shows value at one bookmaker, the best available odds elsewhere might push the edge even further. Academic research on xG-based models applied to the Bundesliga over eleven seasons showed returns of approximately 10% at average market odds but roughly 15% when the best available price was taken consistently. That 5% difference comes purely from shopping for the best line — no additional analysis required, just patience and multiple accounts.
Step 6: Stake according to your system. If you’re using Kelly or a variant, the size of your edge determines the stake size. If flat staking, every qualifying value bet gets the same unit regardless of edge size. Either way, the key is that only bets passing through this filter get staked. Everything else is a spectator event.
This process feels slow at first. After a month it becomes automatic. And the long-term results speak for themselves: models optimised for probability calibration — the skill this process builds — generate nearly 70% higher average returns than those optimised purely for prediction accuracy.
Where Value Hides: Match Result, BTTS, Totals
Not all markets are created equal, and after years of tracking my results by market type, clear patterns have emerged about where value tends to cluster and where it’s hardest to find.
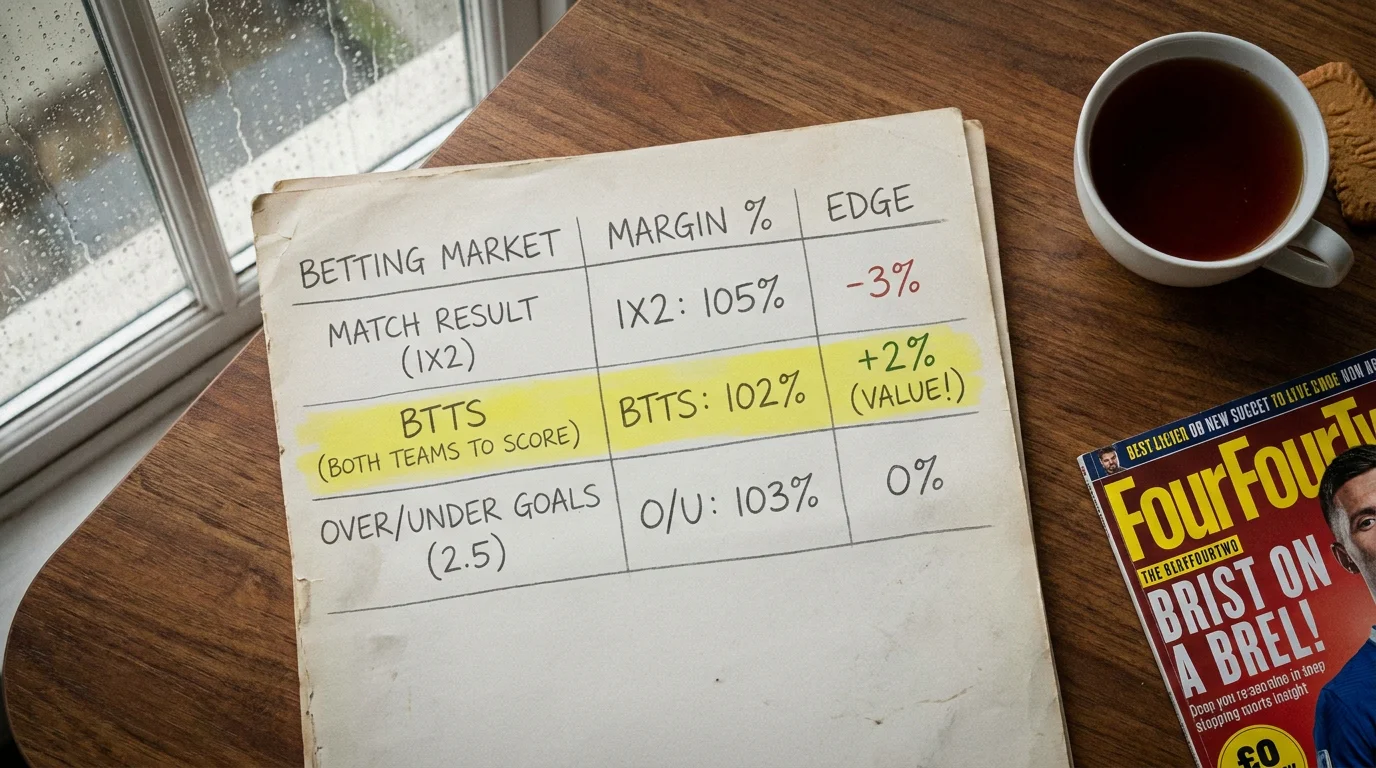
Match result is the most liquid and most efficient market. Bookmakers price it first, with the most sophisticated models, and the volume of money from sharp bettors keeps the odds tight. That doesn’t mean value never exists here — it does, especially on home wins in the Championship and lower leagues where public money tends to overweight recent form and underweight xG. Research on the Bundesliga found that xG-based models generated their best returns from home win bets specifically, which aligns with my own experience: the draw and away win tend to be priced more accurately on average.
Both teams to score is a market where casual bettors dominate. Weekend punters love BTTS because it’s simple and gives them something to cheer for from both sides. That popularity means the “yes” side tends to be slightly overpriced — more money flows toward it, shortening the odds beyond fair value. The “no” side, particularly in matches featuring a side with strong defensive xG numbers, is where I’ve found more consistent edges. It’s less exciting, which is precisely why it’s more profitable.
Totals — over/under goals — sit somewhere in between. The over 2.5 goals line is the most popular, heavily traded, and therefore reasonably efficient. But alternative lines — over 1.5, over 3.5, under 1.5 — receive less attention and carry softer pricing. I’ve had particular success with under 2.5 in fixtures where both teams have been overperforming their xG, meaning they’ve scored more goals than the quality of their chances would predict. The market prices in the actual goals; I price in the underlying shot quality. The correction, when it comes, moves the result toward under.
The broader principle: value lives where attention doesn’t. The most popular markets in the most popular leagues attract the sharpest pricing. Niche markets, alternative lines and lower-league fixtures offer wider margins of error — and for a careful analyst, those errors are exploitable.
There’s also a timing dimension. Odds published on Monday for a Saturday fixture carry more uncertainty than odds available on Saturday morning after team news has dropped. Early prices are based on models and general form; late prices incorporate specific information. I’ve found that betting early — when I have a strong structural opinion — and betting late — when team news creates a sudden shift the market hasn’t fully absorbed — are both profitable. Betting in the middle, when the market has had time to settle but no new information has arrived, is where the edge is thinnest.
One more pattern worth noting: promoted teams in their first season attract biased pricing throughout the autumn. The market tends to anchor on their lower-league status and price them as underdogs even when their summer recruitment and early-season xG suggest otherwise. By November, the market corrects. That three-month window is one of the most reliable value pockets I’ve found in English football.
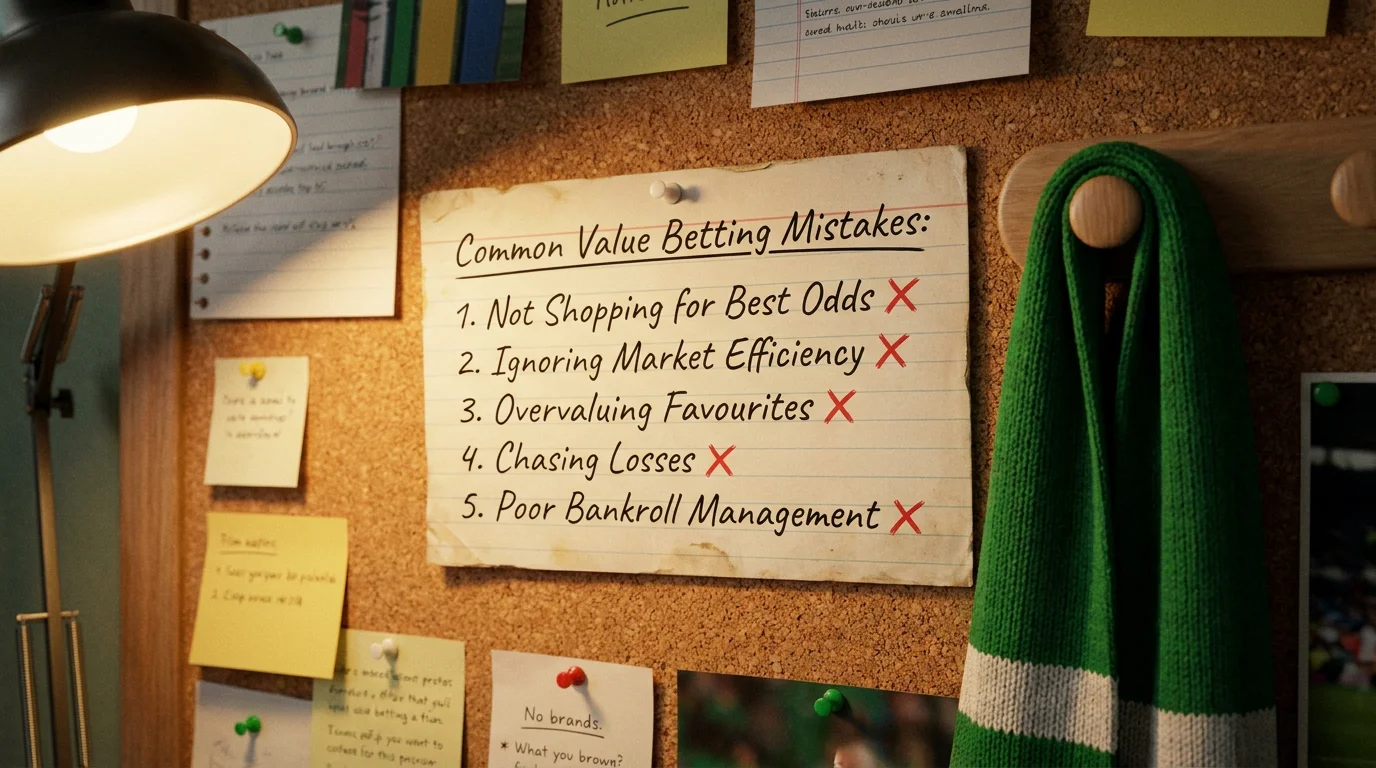
Five Mistakes That Kill Value-Betting Profits
I’ve made all five of these. Some of them more than once. They’re the mistakes that look obvious in hindsight but feel completely reasonable at the time — which is what makes them dangerous.
Mistake one: anchoring to the bookmaker’s price. If you see odds of 5.00 and then start looking for reasons the underdog might win, you’ve already failed. The price shaped your analysis rather than the other way round. Always form your probability estimate blind, then compare it to the market. The order is non-negotiable.
Mistake two: ignoring the overround on exotic markets. A 5% edge on a match result market with a 4% overround is genuine value. A 5% edge on a correct score market with a 15% overround is not — the margin swallows your advantage whole. The UK gambling industry has reached record levels of gross gambling yield, and a significant portion of that revenue comes from bettors chasing high-odds exotic markets where the margin is steepest. Don’t contribute to the statistic.
Mistake three: treating every bet as independent. If you’ve backed the home win and the over 2.5 goals on the same match, those two bets are correlated. A home side that wins is more likely to have been involved in a high-scoring game. Your risk on that fixture is concentrated, not diversified, and you need to account for that when sizing stakes.
Mistake four: abandoning the method after a bad run. Value betting is a long-term game. A sample of fifty bets tells you almost nothing about whether your method works — the variance overwhelms the signal. I don’t evaluate my approach on anything less than 300 bets, and even then I look at process metrics (closing line value, calibration) rather than just profit. If you switch strategies every time you hit a losing week, you’ll never accumulate enough data to prove — or disprove — any of them.
Mistake five: confusing information with insight. Reading three match previews and watching a highlights package doesn’t give you an analytical edge. Thousands of other bettors consumed the same content. Edge comes from processing data the market hasn’t fully absorbed — xG differentials, set-piece dependency, rotational patterns, fixture congestion impacts. If your analysis relies entirely on information that’s widely available and easily digestible, the odds already reflect it.
FAQ
How often do genuine value bets appear in Premier League matches?
In a typical weekend of ten Premier League fixtures, I find two or three selections that clear my value threshold after adjusting for the overround. The Premier League is the most heavily traded football league in the world, so odds are tight and genuine mispricing is less common than in the Championship or lower divisions. Patience is essential — forcing bets on fixtures that don’t show value is the fastest way to erode a positive edge.
Can I value-bet using only free odds-comparison tools?
Yes, and it’s where I started. Free odds comparison sites let you see the best available price across multiple bookmakers, which is critical for maximising your edge. You don’t need paid software to practise value betting — you need the discipline to form your own probability estimates before checking the market, and the patience to only bet when the gap between your estimate and the implied probability exceeds the overround.
What sample size do I need before judging my value-betting results?
At minimum, 300 bets at consistent stakes before drawing any conclusions about profitability. Below that number, variance dominates the signal. A good month of results doesn’t validate your method, and a bad month doesn’t invalidate it. I track rolling 100-bet windows for yield and closing line value to spot trends, but I only make strategic changes based on samples of 300 or more.
