
 Available in US
Content
- What Odds Actually Represent — and What Bookmakers Don't Tell You
- Fractional, Decimal and American: Reading All Three Formats
- From Odds to Probability: The Conversion Every Punter Should Know
- The Built-In Edge: How Bookmaker Margin Shapes Every Price
- Why Odds Drift and Shorten: Team News, Money and Market Forces
- Odds Comparison: Finding the Best Price Across UK Bookmakers
- FAQ
What Odds Actually Represent — and What Bookmakers Don’t Tell You
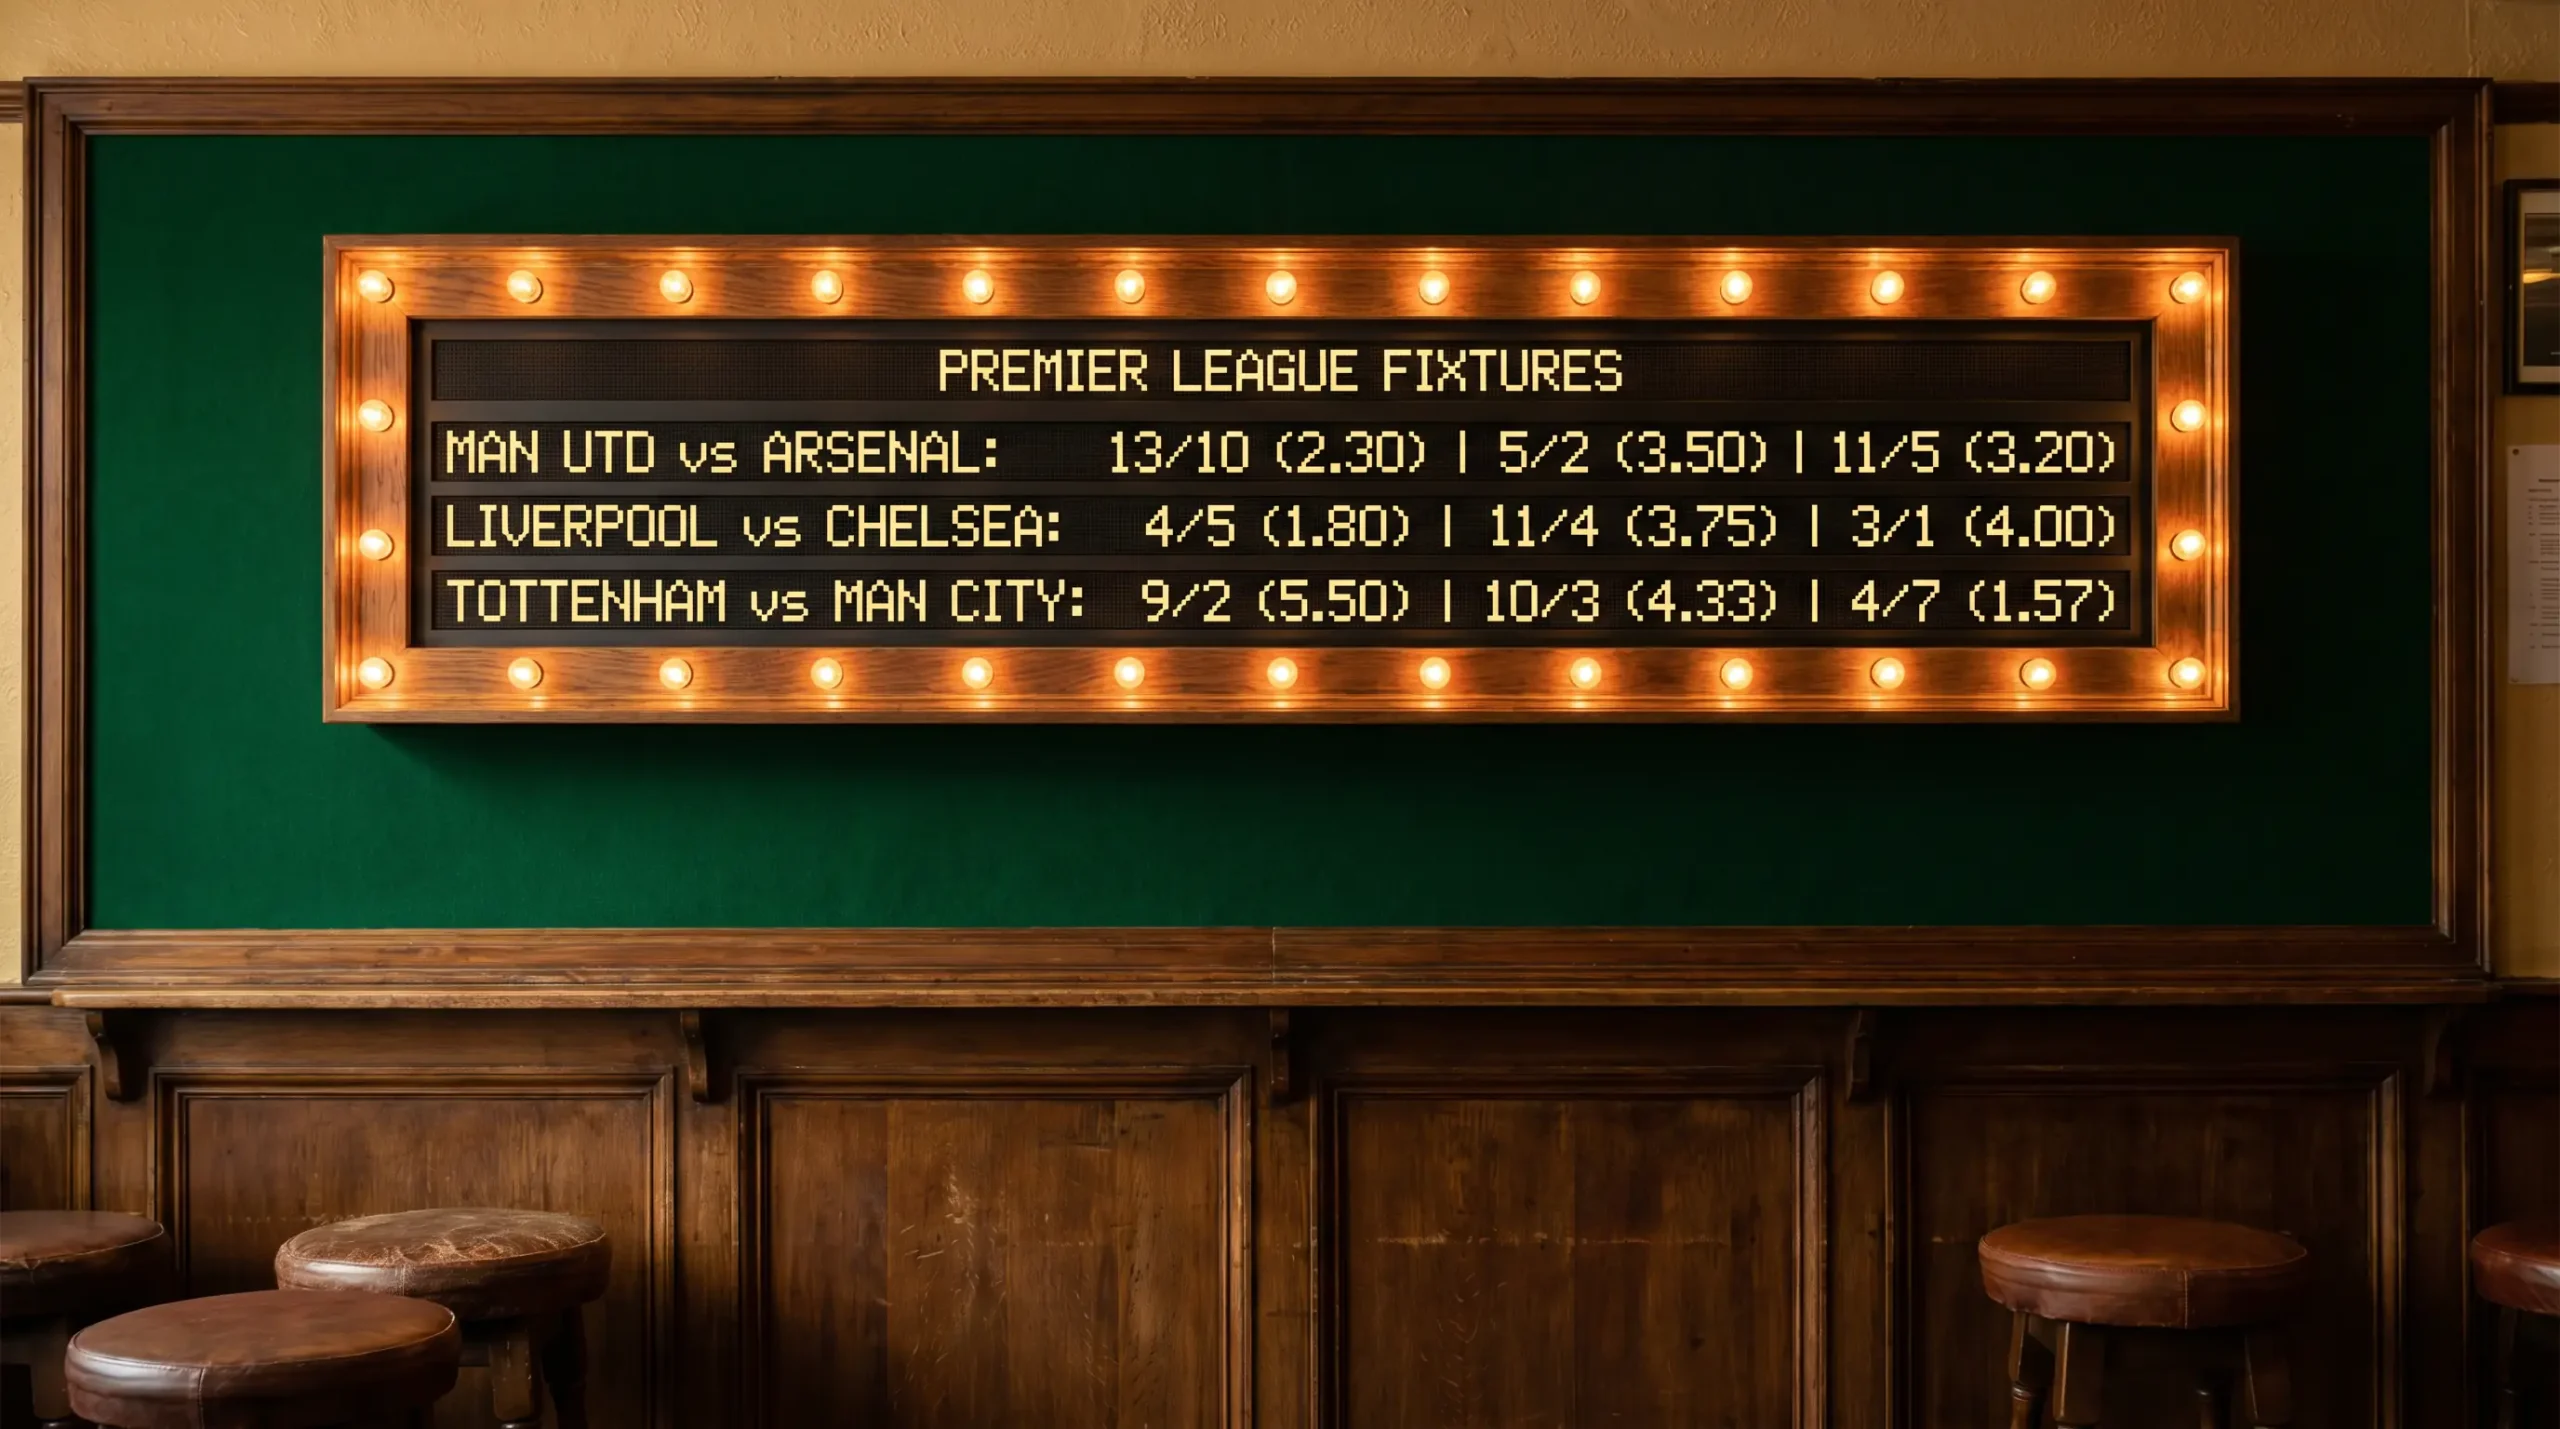
When I started betting on football, I thought odds were the bookmaker’s prediction of what would happen. If Arsenal were 1.80 to beat Wolves, that meant the bookmaker thought Arsenal would win. Simple. Obvious. And completely wrong.
Odds are prices, not predictions. They represent a price the bookmaker is willing to offer for a specific outcome, adjusted to ensure they make a profit regardless of the result. The distinction matters enormously, because once you understand that odds are a commercial product rather than an analytical forecast, you start evaluating them differently. You stop asking “do I agree with the bookmaker?” and start asking “is this price fair — or has the bookmaker left money on the table?”
Every set of odds on a football match contains two layers of information. The first is the bookmaker’s assessment of the probability of each outcome — home win, draw, away win. The second is their margin: the extra percentage they build into every price to guarantee a profit over time. On a standard Premier League match result market, that margin typically runs 4% to 7%. It means the odds you see are always slightly worse than the bookmaker’s true estimate of the probabilities. That built-in disadvantage is the house edge, and it applies to every bet you place, on every market, at every bookmaker. Understanding how it works — and how to minimise its impact — is the most important thing I’ve learned in nine years of football betting.
Fractional, Decimal and American: Reading All Three Formats
Walk into a high street bookmaker and you’ll see fractional odds: 5/2, 6/4, 11/10. Open a betting app and you’ll likely see decimals: 3.50, 2.50, 2.10. Follow an American sports account and you’ll encounter moneylines: +250, +150, -110. They’re three different languages for the same information, and being comfortable with all three makes you a more efficient bettor — because the best price on a match might be posted by a bookmaker that defaults to a format you’re not used to.
Fractional odds are the traditional UK format. The number on the left is your potential profit; the number on the right is your stake. At 5/2, a two-pound stake returns five pounds profit plus your two pounds back — seven pounds total. At 6/4, a four-pound stake returns six pounds profit plus four back — ten total. At 1/3, you need to stake three pounds to win one. Fractions are intuitive for some people, particularly those who grew up with horse racing. Personally, I find them cumbersome for quick mental calculations, especially with awkward numbers like 11/8 or 100/30.
Decimal odds show your total return per unit staked, including the stake itself. Odds of 3.50 mean a one-pound bet returns three pounds fifty in total — two pounds fifty profit plus your pound back. The beauty of decimals is that comparison is instant: 3.50 is obviously better than 3.40, whereas comparing 5/2 and 12/5 requires mental arithmetic that slows you down. I switched to decimal odds in my second year and have never gone back. Every calculation in this article — implied probability, margin, expected value — is easier in decimals.
American odds are expressed as positive or negative numbers. Positive odds (+250) tell you how much profit you’d make on a 100-unit stake: +250 means a 100-pound bet returns 250 profit. Negative odds (-150) tell you how much you need to stake to win 100: -150 means a 150-pound bet returns 100 profit. You’ll rarely encounter American odds on UK betting sites, but they appear regularly on international platforms, exchanges and in US-focused analysis. The conversion to decimal is straightforward: for positive odds, divide by 100 and add 1 (so +250 becomes 3.50); for negative odds, divide 100 by the absolute number and add 1 (so -150 becomes 1.667).
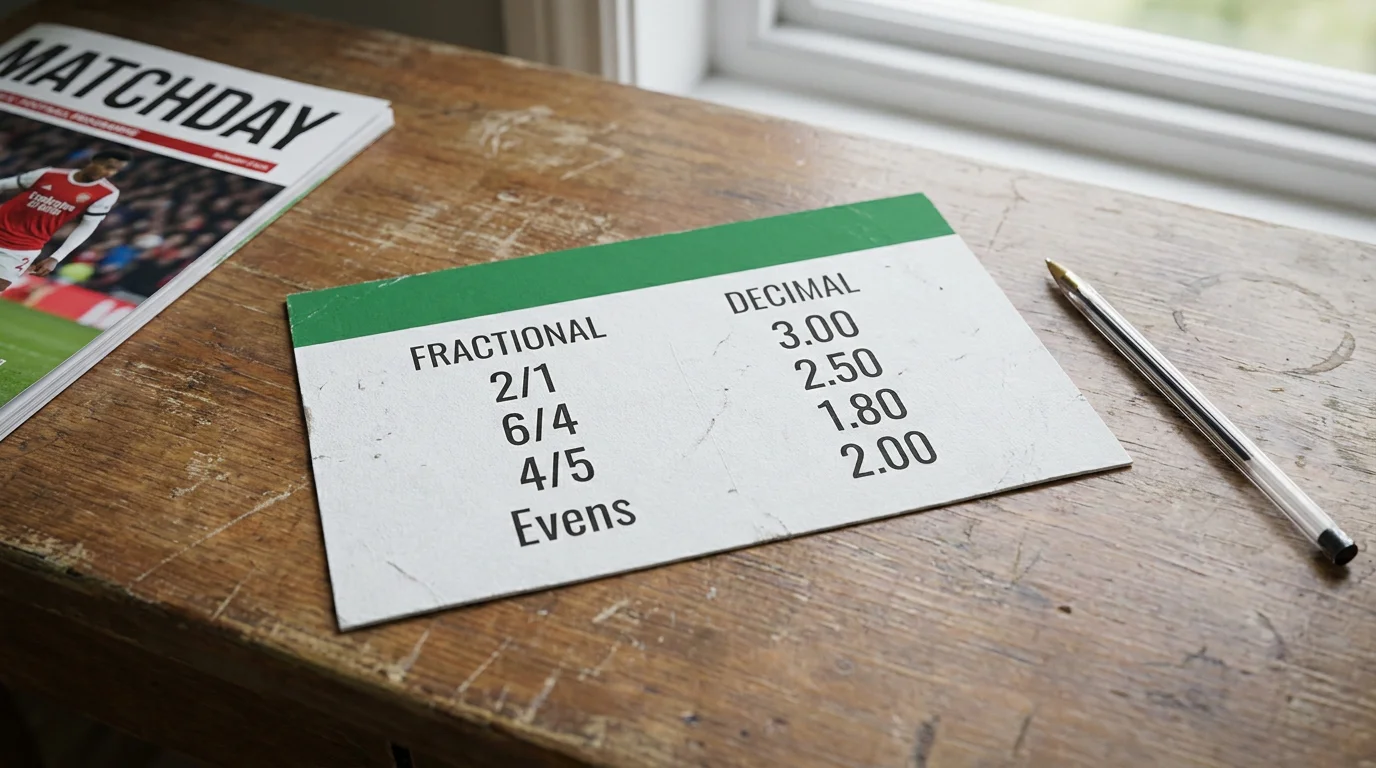
Quick reference for the conversions you’ll use most often: 2/1 in fractions equals 3.00 in decimals. Evens (1/1) equals 2.00. 4/5 equals 1.80. 1/4 equals 1.25. 10/11 equals 1.91, which is a price you’ll see constantly on match result markets. Once you know a handful of these anchor points, converting between formats on the fly becomes second nature.
From Odds to Probability: The Conversion Every Punter Should Know
Here’s a question that changed how I think about betting: when a bookmaker offers odds of 2.00, what are they actually telling you? The answer is that they’re implying the outcome has a 50% chance of happening — but they’re also baking in a margin that means they believe the true probability is slightly higher than 50%. Understanding that gap is the first step toward identifying value.
The conversion formula for decimal odds is clean: divide 1 by the odds and multiply by 100. At odds of 2.00, that’s 1 divided by 2.00 equals 0.50, or 50%. At 3.00, it’s 33.3%. At 1.50, it’s 66.7%. At 5.00, it’s 20%. Once you’ve practised this a few dozen times, you’ll start seeing probabilities instead of prices — and that perceptual shift is the single most valuable skill a football bettor can develop.
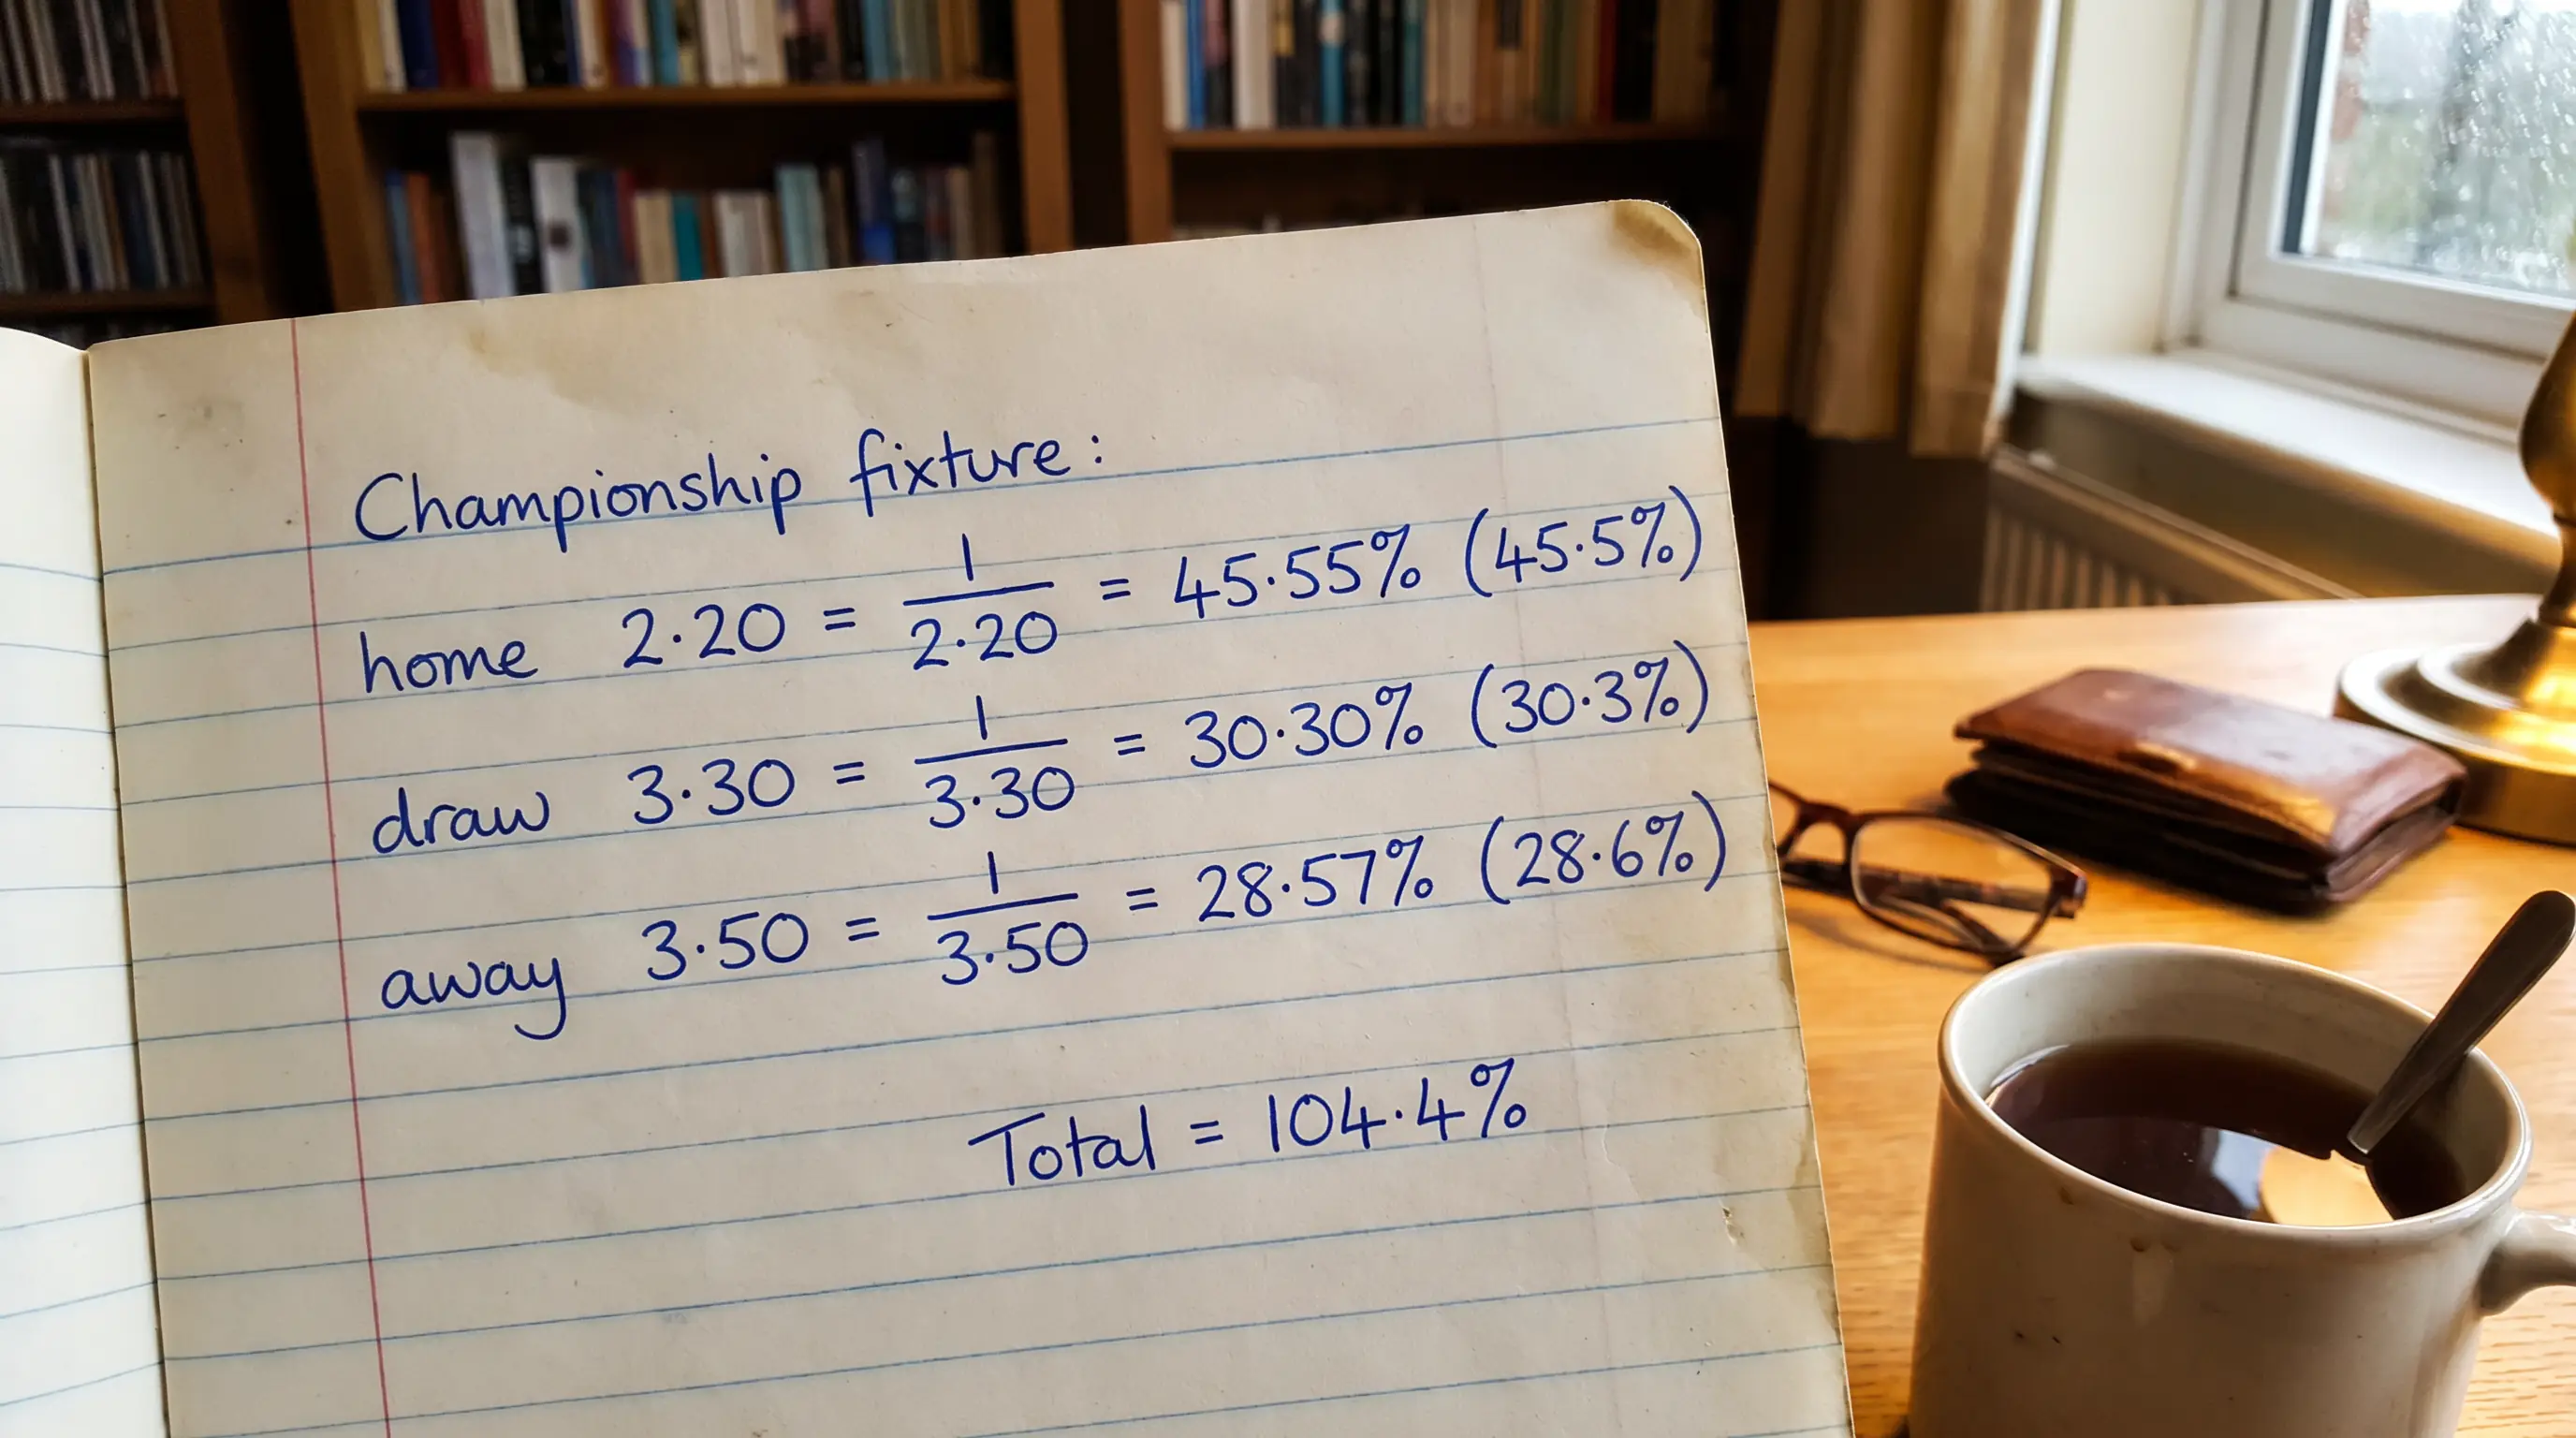
Let me walk through a full match. Suppose a Championship fixture is priced: home 2.20, draw 3.30, away 3.50. Converting each:
Home win: 1 / 2.20 = 45.5%. Draw: 1 / 3.30 = 30.3%. Away win: 1 / 3.50 = 28.6%. Total: 104.4%.
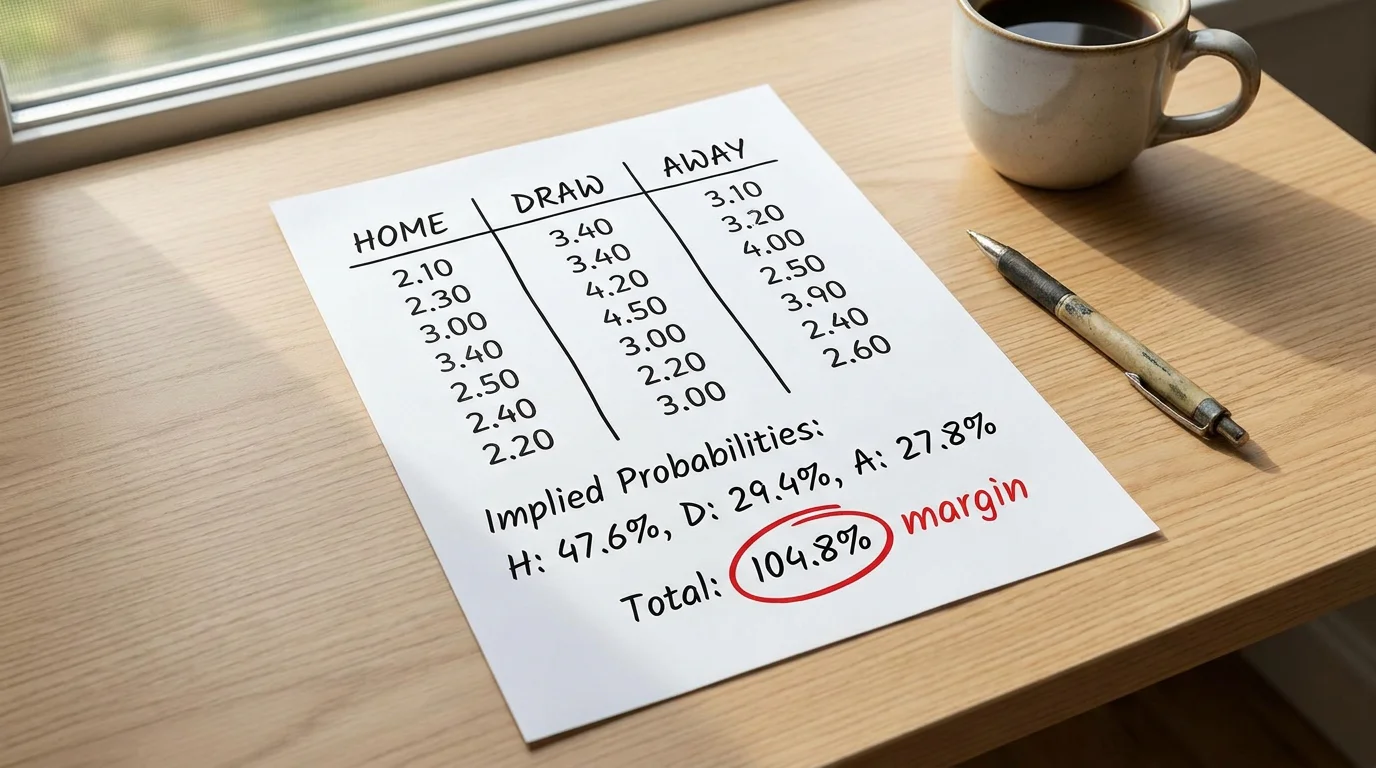
In a perfectly fair market with no margin, those three numbers would sum to exactly 100%. The 4.4% excess is the bookmaker’s overround — their profit margin expressed as the gap between the prices offered and the true probabilities underneath. Every price is slightly shorter than it should be. The home win isn’t really 45.5% — the bookmaker probably estimates it at something like 43.5% and adds a couple of percentage points of margin. Same for the draw and the away win.
For fractional odds, the conversion is: denominator / (numerator + denominator) times 100. At 6/4, that’s 4 / (6+4) = 40%. At 2/1, it’s 1 / (2+1) = 33.3%. At 4/7, it’s 7 / (4+7) = 63.6%.
Why does this matter in practice? Because your job as a bettor is to form your own probability estimate for each outcome and compare it to the implied probability from the odds. If you estimate the home side in that Championship match has a 50% chance of winning but the implied probability is only 45.5%, that 4.5% gap is a potential value opportunity. If you estimate 44%, the bet offers no value — the market agrees with you, and the margin means you’re paying a premium for the privilege. This comparison — your number versus their number — is the foundation of every disciplined betting decision. Master this one skill and you’ll be better equipped than the vast majority of punters who never look beyond the headline odds.
The Built-In Edge: How Bookmaker Margin Shapes Every Price
A mate once told me he’d found a “guaranteed profit” strategy: back all three outcomes on a match at different bookmakers and guarantee a return. I asked him to run the numbers. He couldn’t make it work. The reason is the overround — the margin the bookmaker builds into every market that ensures the total implied probability exceeds 100%, making it mathematically impossible to profit by backing all outcomes at a single bookmaker, and extremely difficult even across multiple ones.
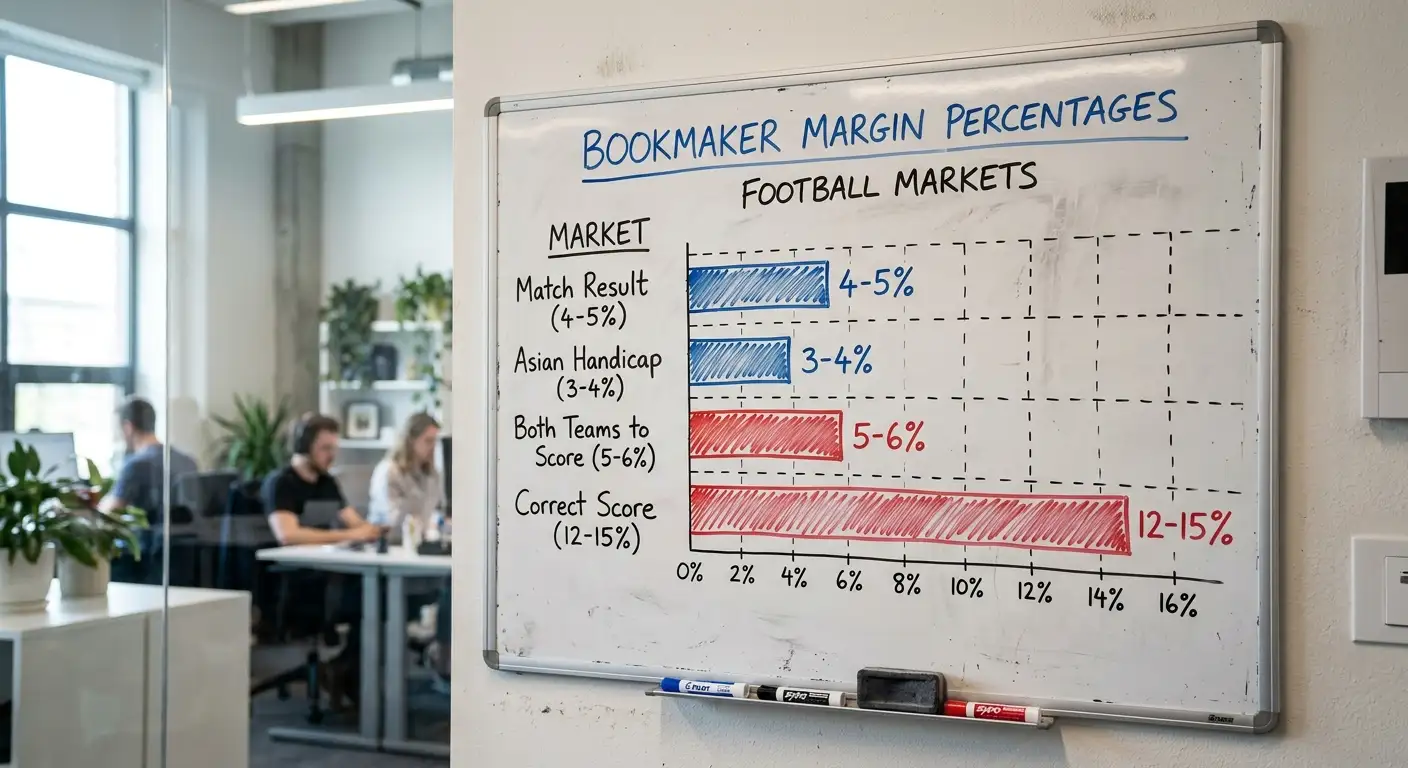
The size of the margin varies by market and competition. On a Premier League match result, expect a combined overround of 4% to 5%. On a Champions League final, where trading volume is enormous and competition between bookmakers is fierce, margins can drop to around 3%. On a League Two fixture on a midweek evening, 6% to 7% is common. And on exotic markets — correct score, first goalscorer, half-time/full-time — the margin can reach 15% or more because the larger number of possible outcomes lets the bookmaker spread thin slices of margin across each price without any single odds looking unreasonable.
Remote betting in the UK generates over 2.6 billion pounds in gross gambling yield annually, with football accounting for roughly 1.3 billion of that. The margin is the engine that drives those numbers. Every price, on every market, is set below the fair value — and the cumulative effect across millions of bets per month is an industry that reliably profits regardless of individual match outcomes.
For you as a bettor, the margin defines your hurdle rate. On a 5% margin market, you need your analysis to outperform the bookmaker’s estimate by more than 5% just to break even. On a 3% margin market, your hurdle is lower — and that’s why I concentrate the majority of my betting on low-margin markets (match result, Asian handicap) and treat high-margin markets (correct score, specials) as occasional positions rather than regular plays.
Knowing the margin also helps you compare bookmakers. If one operator runs a 3.8% overround on a specific match and another runs 5.2%, the first is offering better value across the board — regardless of which individual price looks highest at a glance. I check the overround as routinely as I check the odds, and it’s shaped where I place my money more than any promotional offer.
Why Odds Drift and Shorten: Team News, Money and Market Forces
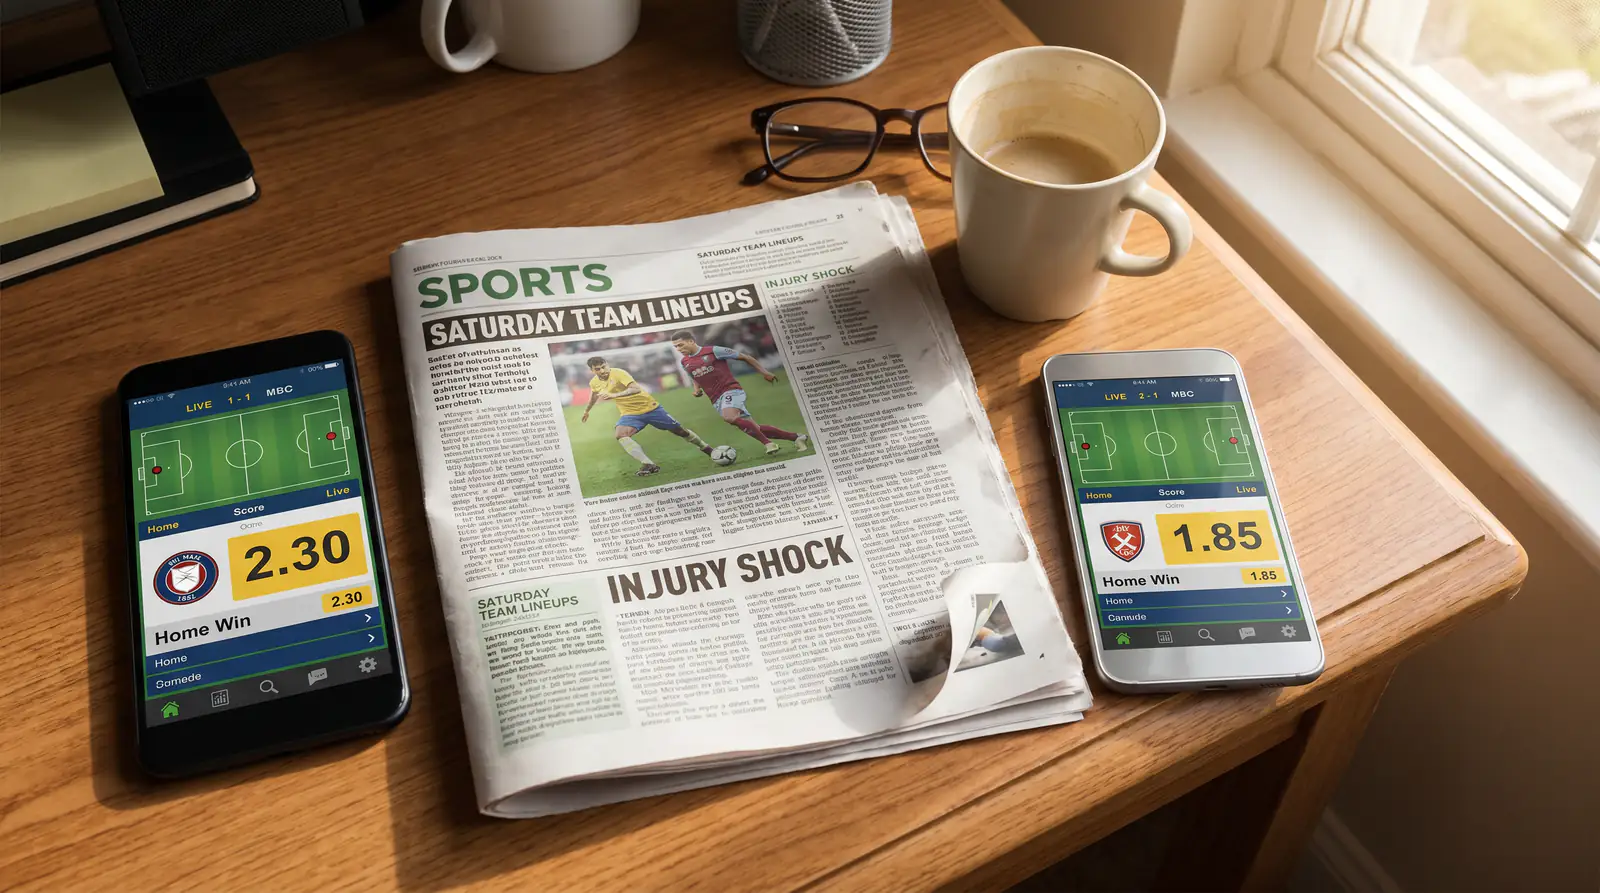
I once placed a pre-match bet on a home win at 2.30 on a Thursday evening. By Saturday lunchtime, the same bet was 1.85. My selection hadn’t changed; the odds had shortened because the star striker had been confirmed fit after a doubt, and money flooded in on the home side. That price movement — from 2.30 to 1.85 — was the market digesting new information, and it illustrates a fundamental point: football odds are not static. They move constantly between the moment they’re posted and kick-off.
Three forces drive odds movement. The first is team news. Confirmed absences of key players shift probabilities, and the market adjusts quickly once official lineups are announced — typically one hour before kick-off. A missing goalkeeper or star forward will move the price within minutes. A missing defensive midfielder might take longer because casual bettors undervalue the position. That lag is an opportunity for anyone who understands squad dynamics.
The second force is money. When large volumes of money land on one outcome, the bookmaker shortens the odds on that selection and lengthens the odds on the others to manage their liability. This is a balancing act: the bookmaker wants to attract roughly proportional money on all outcomes so that the overround guarantees profit regardless of the result. Sharp money — bets from known profitable accounts — carries more weight than recreational money. A single large bet from a sharp account can move the market more than thousands of small casual bets.
The third force is market-wide adjustment. Bookmakers watch each other’s prices. If one operator moves a line, others follow within minutes to avoid being exploited by arbitrage bettors who back mispriced outcomes across multiple platforms. With over 290 million online bets placed monthly in the UK on real events, the sheer volume of trading activity means prices converge rapidly. The closing price — the last available odds before kick-off — is typically the most accurate reflection of true probability, because it has absorbed all available information and market forces.
Andrew Rhodes, who led the Gambling Commission during a period when gross gambling yield reached its highest ever recorded level, observed that if you adjust for inflation the relative value of gambling has actually fallen in recent years. That comment speaks to the maturation of the market: prices are tighter, margins are thinner on major events, and the window for exploiting mispriced odds is narrower than it was a decade ago. The implication for punters is clear — timing and price shopping matter more than ever.
Odds Comparison: Finding the Best Price Across UK Bookmakers
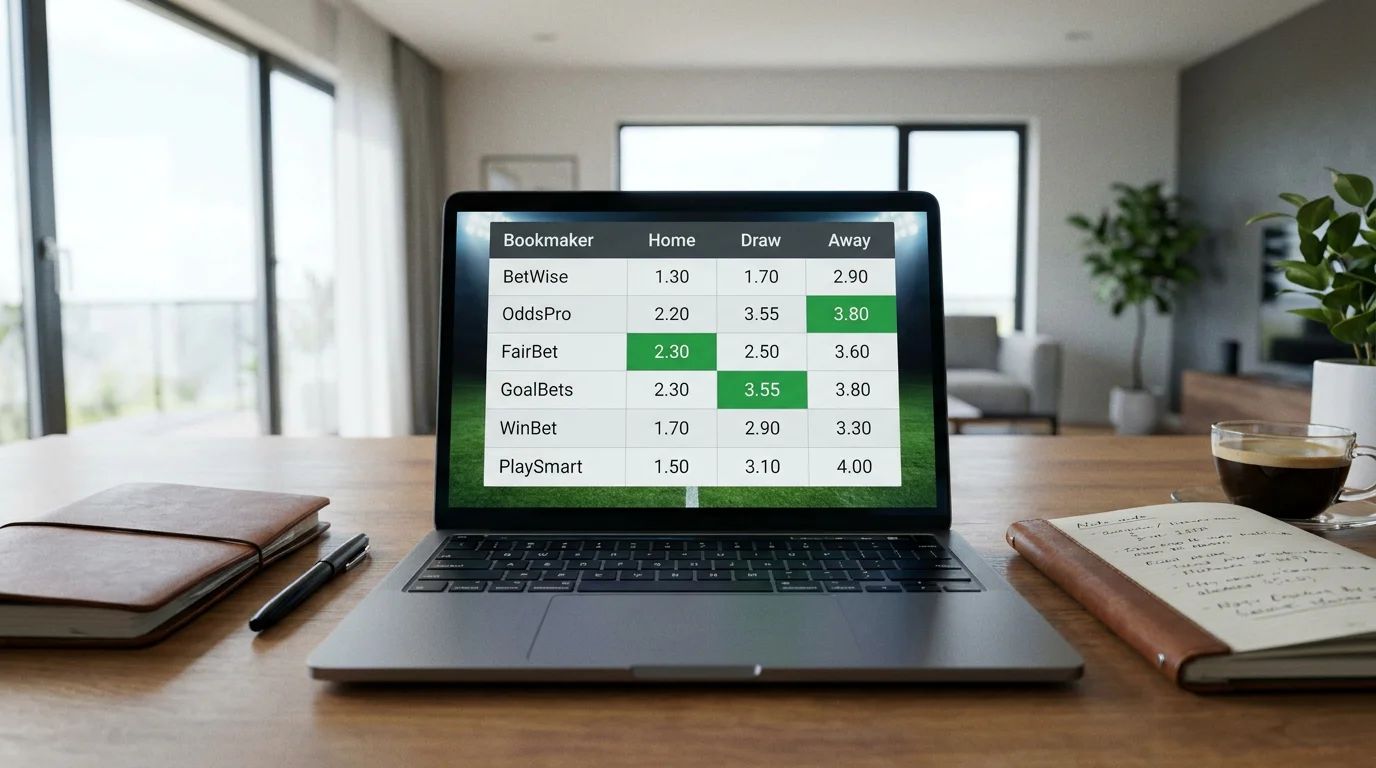
If I could give one piece of advice to every football bettor in the country, it would be this: stop placing bets at the first bookmaker you open. The price difference between the best and worst available odds on a single outcome can be the difference between a profitable bet and a losing one. Sports betting accounts for over 57% of UK online gambling revenue, and a meaningful portion of that revenue comes from bettors who accept the first price they see.
Odds comparison takes thirty seconds per bet. Free comparison sites aggregate prices from every major UK bookmaker in real time, letting you see the best available odds on any match at a glance. The difference between 2.10 and 2.25 on the same outcome is 7% better returns for exactly the same bet with exactly the same analysis. Over a season of three hundred bets, that consistent 5% to 7% improvement in average odds can transform a break-even record into a profitable one.
I maintain active accounts with at least six UK-licensed bookmakers. Not because I enjoy managing logins, but because each operator prices markets slightly differently depending on their model, their liability and their competitive positioning. One bookmaker might be consistently sharp on Premier League match result but soft on Championship totals. Another might offer the best Asian handicap lines because they cater to a more international audience. Knowing which operator leads on which market is a quiet edge that compounds silently over time.
A practical tip: compare odds in the morning for evening kick-offs and on Friday for Saturday fixtures. Early odds carry more uncertainty and wider margins, which means the variation between bookmakers is greatest early in the week. By the time team news drops and the market tightens, the opportunity to find a significantly better price narrows. I’ve developed a habit of scanning comparison sites at a fixed time each day — usually around 10 a.m. — and flagging matches where the dispersion between best and worst odds is unusually wide. That dispersion often signals that one bookmaker has been slow to adjust to information that others have already priced in.
The Asian handicap market deserves special mention here. Because it attracts sharper money and has fewer outcomes than the match result market, the margin tends to be tighter — and the variation between bookmakers is smaller but still significant. If you’re serious about odds shopping, Asian handicap lines should be part of your comparison routine.
FAQ
Should I use fractional or decimal odds for football betting?
Decimal odds are simpler for calculation. Every formula you need — implied probability, expected value, margin — is easier in decimals. Most UK betting sites let you switch format in your account settings. I’d recommend making the switch permanently unless you have a strong personal preference for fractions. The analytical advantage is real and compounding.
Why do two bookmakers offer different odds on the same match?
Each bookmaker runs its own pricing model with different inputs, risk tolerances and customer profiles. One might have received heavy money on the home win, shortening that price, while another hasn’t. The liability each operator carries on a match also affects their pricing. These differences create the opportunity for odds shopping, and they’re the reason maintaining accounts at multiple bookmakers is valuable.
What is the average bookmaker margin on a Premier League match?
On the match result market, typical margins fall between 4% and 5%. On major fixtures like the top-six clashes, margins can tighten to around 3% due to high trading volume and competitive pressure. On exotic markets — correct score, first goalscorer, specials — margins can exceed 10% to 15%. Knowing the margin before you bet tells you how large your analytical edge needs to be to overcome the house advantage.
Do odds always reflect the true probability of an outcome?
No. Odds reflect the bookmaker’s estimated probability plus their margin, further adjusted by the flow of money from bettors. The closing odds — the final price before kick-off — are the best approximation of true probability because they’ve absorbed the most information. But even closing odds are imperfect, and that imperfection is where value bettors find their edge.
