
 Available in US
Content
Why Corners Attract Fewer Eyes – and That’s the Point
I started tracking corners data because I was losing money on goals markets. Not a lot – enough to be annoying but not enough to quit. The problem was that goals markets attract the most public money, which means the pricing is sharp. When 290 million online bets are placed monthly in the UK and a large chunk flows through over/under goals and BTTS, the bookmaker’s algorithm has more than enough data to price those markets efficiently. I needed a market where less attention meant softer pricing.
Corners turned out to be that market. The total corners line on a Premier League match draws a fraction of the money that the goals line attracts, and the pricing reflects it. Bookmaker margins on corners markets are often wider than on goals markets – which sounds like a disadvantage, but it also means the odds are less precisely calibrated, which creates more room for a bettor with specific data to find mispriced lines.
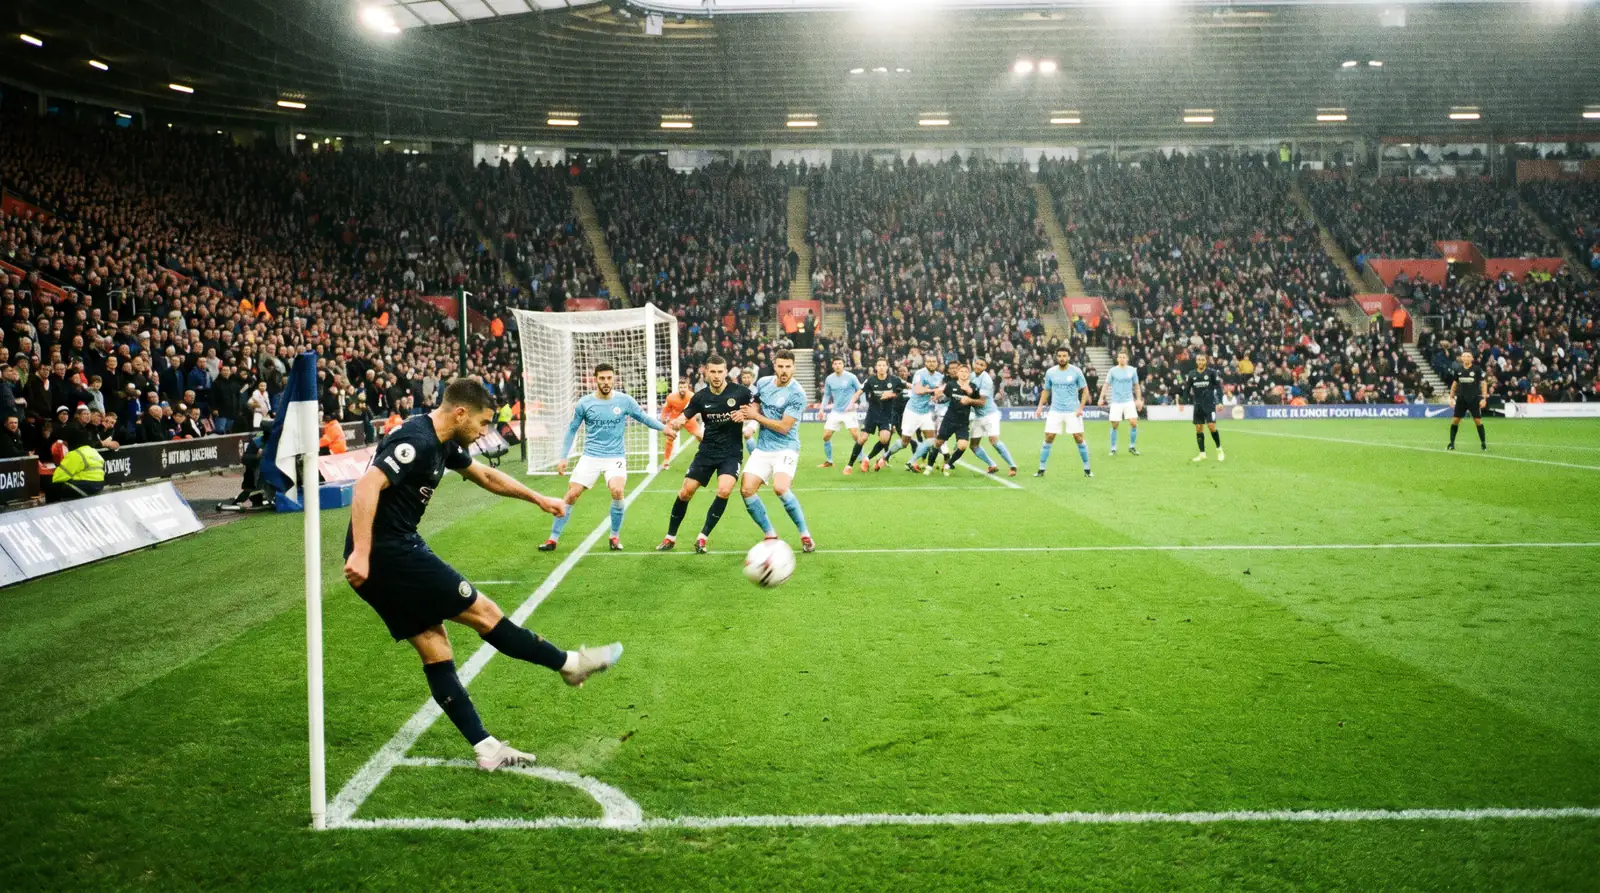
The other advantage of corners is that they are driven by tactical and territorial factors that are more predictable than goals. A goal requires a shot to hit the target and beat the goalkeeper – a high-variance event. A corner requires a team to attack down the flanks and force the ball out of play near the opposition goal – a pattern of play that repeats reliably when the tactical conditions are right.
Territorial Dominance, Crossing Volume and Set-Piece Dependency
Research into xG models across 11 Bundesliga seasons demonstrated that expected goals data could generate ROI of roughly 10% at average market odds. The same principle – using underlying performance metrics rather than headline results – applies to corners, but with a different set of data points.

The first metric I check is territorial dominance, which I approximate through possession in the attacking third. A team that spends 60% or more of its possession in the opposition’s third is, by definition, pushing the ball into areas where corners arise. When that team faces a side that defends deep and blocks crosses, the ball gets deflected behind the goal line repeatedly. High attacking-third possession combined with a deep-block opponent is the strongest single predictor of corner volume I have found.
The second metric is crossing volume. Teams that play wide and deliver crosses generate more corners than teams that play through the centre. A full-back who puts in fifteen crosses a game is creating corner opportunities on every delivery that gets blocked or deflected. I track crosses per game for each team and flag fixtures where both sides have high crossing volumes – those matches consistently overshoot the total corners line.
The third metric is set-piece dependency. Some teams – particularly in the Championship and lower divisions – score a disproportionate share of their goals from set pieces. These teams tend to engineer corners deliberately, using short corners, routines, and positional play designed to win successive corners from the same attack. When two set-piece-dependent sides meet, the corner count inflates because both managers are actively trying to create them.

One pattern I have tracked across four Premier League seasons: matches between a top-six side playing at home against a team in the bottom half produce an average of 11.3 corners, compared to the league average of 10.2. The dominant home side attacks relentlessly, the visitors sit deep and defend, and the ball keeps bouncing off shins and going behind. That one-corner difference does not sound dramatic, but it consistently pushes the match over the standard total corners line of 10.0 or 10.5.

Live Corners Betting: Spotting the Shift at Half-Time
If pre-match corners betting is about tactical prediction, live corners betting is about tactical observation. And this is where the market is at its weakest, because the in-play corners algorithm relies on pre-match models that do not always adjust quickly enough to what is happening on the pitch.
Michael Dugher, who chaired the Betting and Gaming Council, described the industry as having embraced change and engaged positively with government to shape the regulatory landscape. That engagement has included rapid growth in live betting markets, but the sophistication of in-play pricing varies significantly by market. Goals markets are repriced almost instantly after match events. Corners markets lag behind, sometimes by several minutes, which creates windows of opportunity for bettors who are watching the match and reading the tactical shifts in real time.
The half-time interval is the most valuable moment in live corners betting. A manager trailing at half-time will typically make tactical adjustments – pushing full-backs higher, introducing a winger, or switching to a more attacking formation. These changes increase attacking-third activity and, consequently, corner frequency. If the first half produced four corners and the tactical shift at half-time is visible, the second half is likely to produce more – but the in-play total corners line does not always account for this asymmetry. I have found consistent value in backing over the second-half corners line when a trailing team makes visible attacking changes at the break.

The reverse is also true. When both teams are level and content with a draw – particularly in a match with low stakes late in the season – the second half tends to produce fewer corners than the first because neither side is pushing for a goal. Laying the second-half corners line in dead rubber fixtures is a small but repeatable edge.
Corners data pairs well with other player-level markets. If you are building same-game multis that include corners, shots, and cards, the bet builder strategy guide covers how to check leg correlation before combining them.

Are corners more predictable than goals?
In some respects, yes. Corners are driven by territorial patterns – attacking-third possession, crossing volume, defensive shape – that repeat more reliably than the high-variance event of a shot beating a goalkeeper. A team that averages twelve corners per game will produce close to that number more consistently than a team averaging 2.5 goals per game will produce close to that number. The variance is lower, which makes the data more reliable for prediction.
What stats should I check before betting on corners?
Focus on three data points: attacking-third possession percentage for both teams, crosses per game (particularly from full-backs and wingers), and the team-level corners-per-game average split by home and away. Also check the opposition’s defensive style – deep-block teams that sit in a low defensive line concede more corners than teams that press high and win the ball in midfield. The combination of a high-crossing attacking team versus a deep-defending side is the strongest trigger for high corner counts.
