

 Available in US
Content
A Win Isn’t Always Good Form
In January 2024 I backed a Championship side sitting on WWWDW in their last five. The form guide screamed confidence, momentum, a team in the groove. What it did not scream was that three of those wins came against the division’s three weakest sides by xG, that their goalkeeper had made fourteen saves above expected across the run, and that they had conceded the first goal in four of those five matches. They lost 3-0 and I learned, not for the first time, that the W-D-L line on a coupon is the most misleading statistic in football betting.
Football generates £1.1 billion in GGY from UK betting alone. A good portion of that revenue comes from punters who glance at a five-match form string and make a decision. The bookmaker’s pricing model goes much deeper than that, which is why the casual bettor consistently ends up on the wrong side of the margin. Reading form properly means interrogating the results, not accepting them at face value.
Five Layers of Form: Results, xG, Shots, Schedule, Squad Rotation
I assess form across five layers, and the W-D-L record is only the first.
Layer one is the headline results — but with context. A win against the league leaders is not the same as a win against a side already relegated. I weight results by opponent quality, using league position as a rough proxy and xG-against as a finer one. Three wins against bottom-half sides and two losses against the top six is not poor form — it is exactly what you would expect from a mid-table team performing to their level. The question is whether the bookmaker’s price reflects that nuance or treats WWLWL as an unqualified wobble.
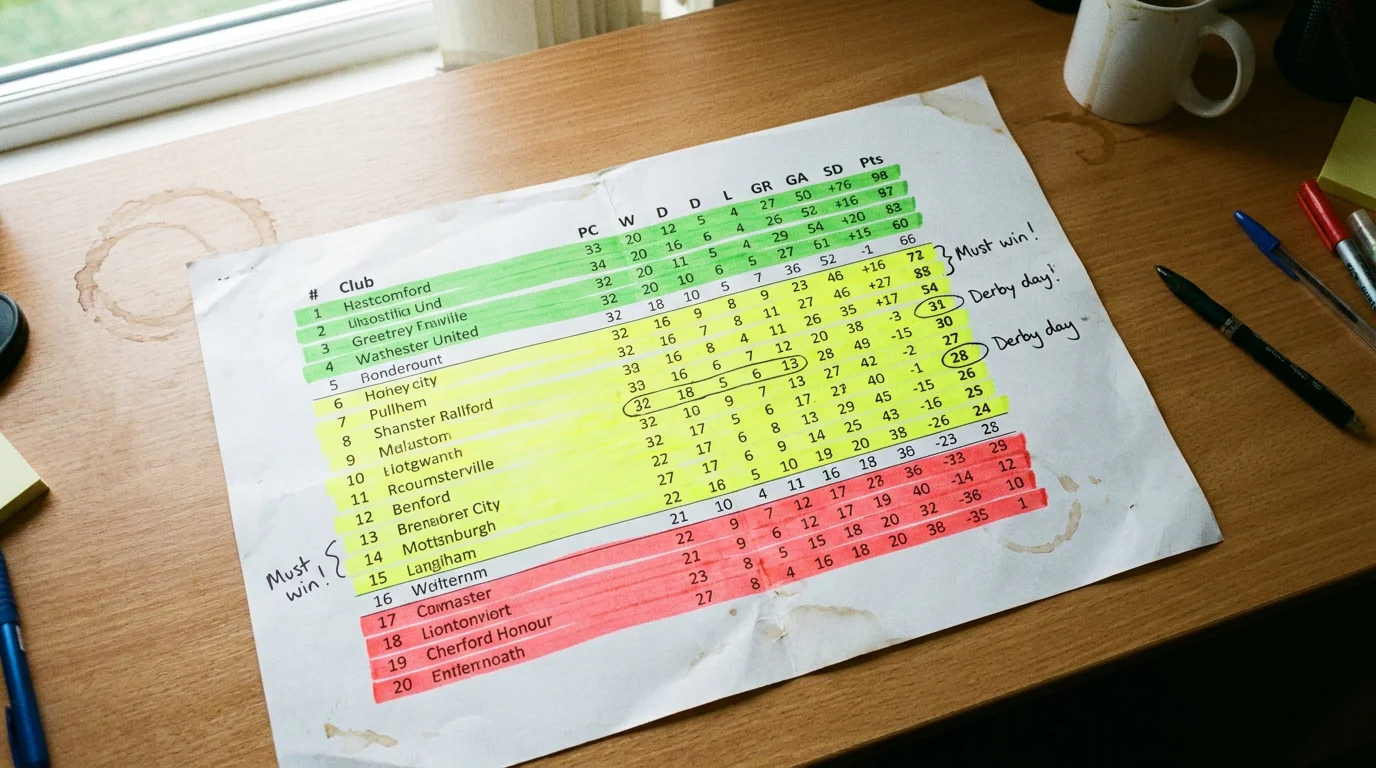
Layer two is xG performance, the underlying quality of chances created and conceded. This is where the real signal lives. A team posting xG numbers significantly above their actual goals will see regression pull results upward over the next few weeks. A team outperforming their xG will drift the other way. The Bundesliga study from SAGE Journals found that xG-based models could identify value at a rate that produced 10% ROI over eleven seasons — and the mechanism was exactly this kind of regression-to-the-mean identification. Football betting generated GGY of £1.3 billion from remote betting in the year to March 2025, and a non-trivial chunk of that comes from bookmakers who price current results slightly more than underlying performance.

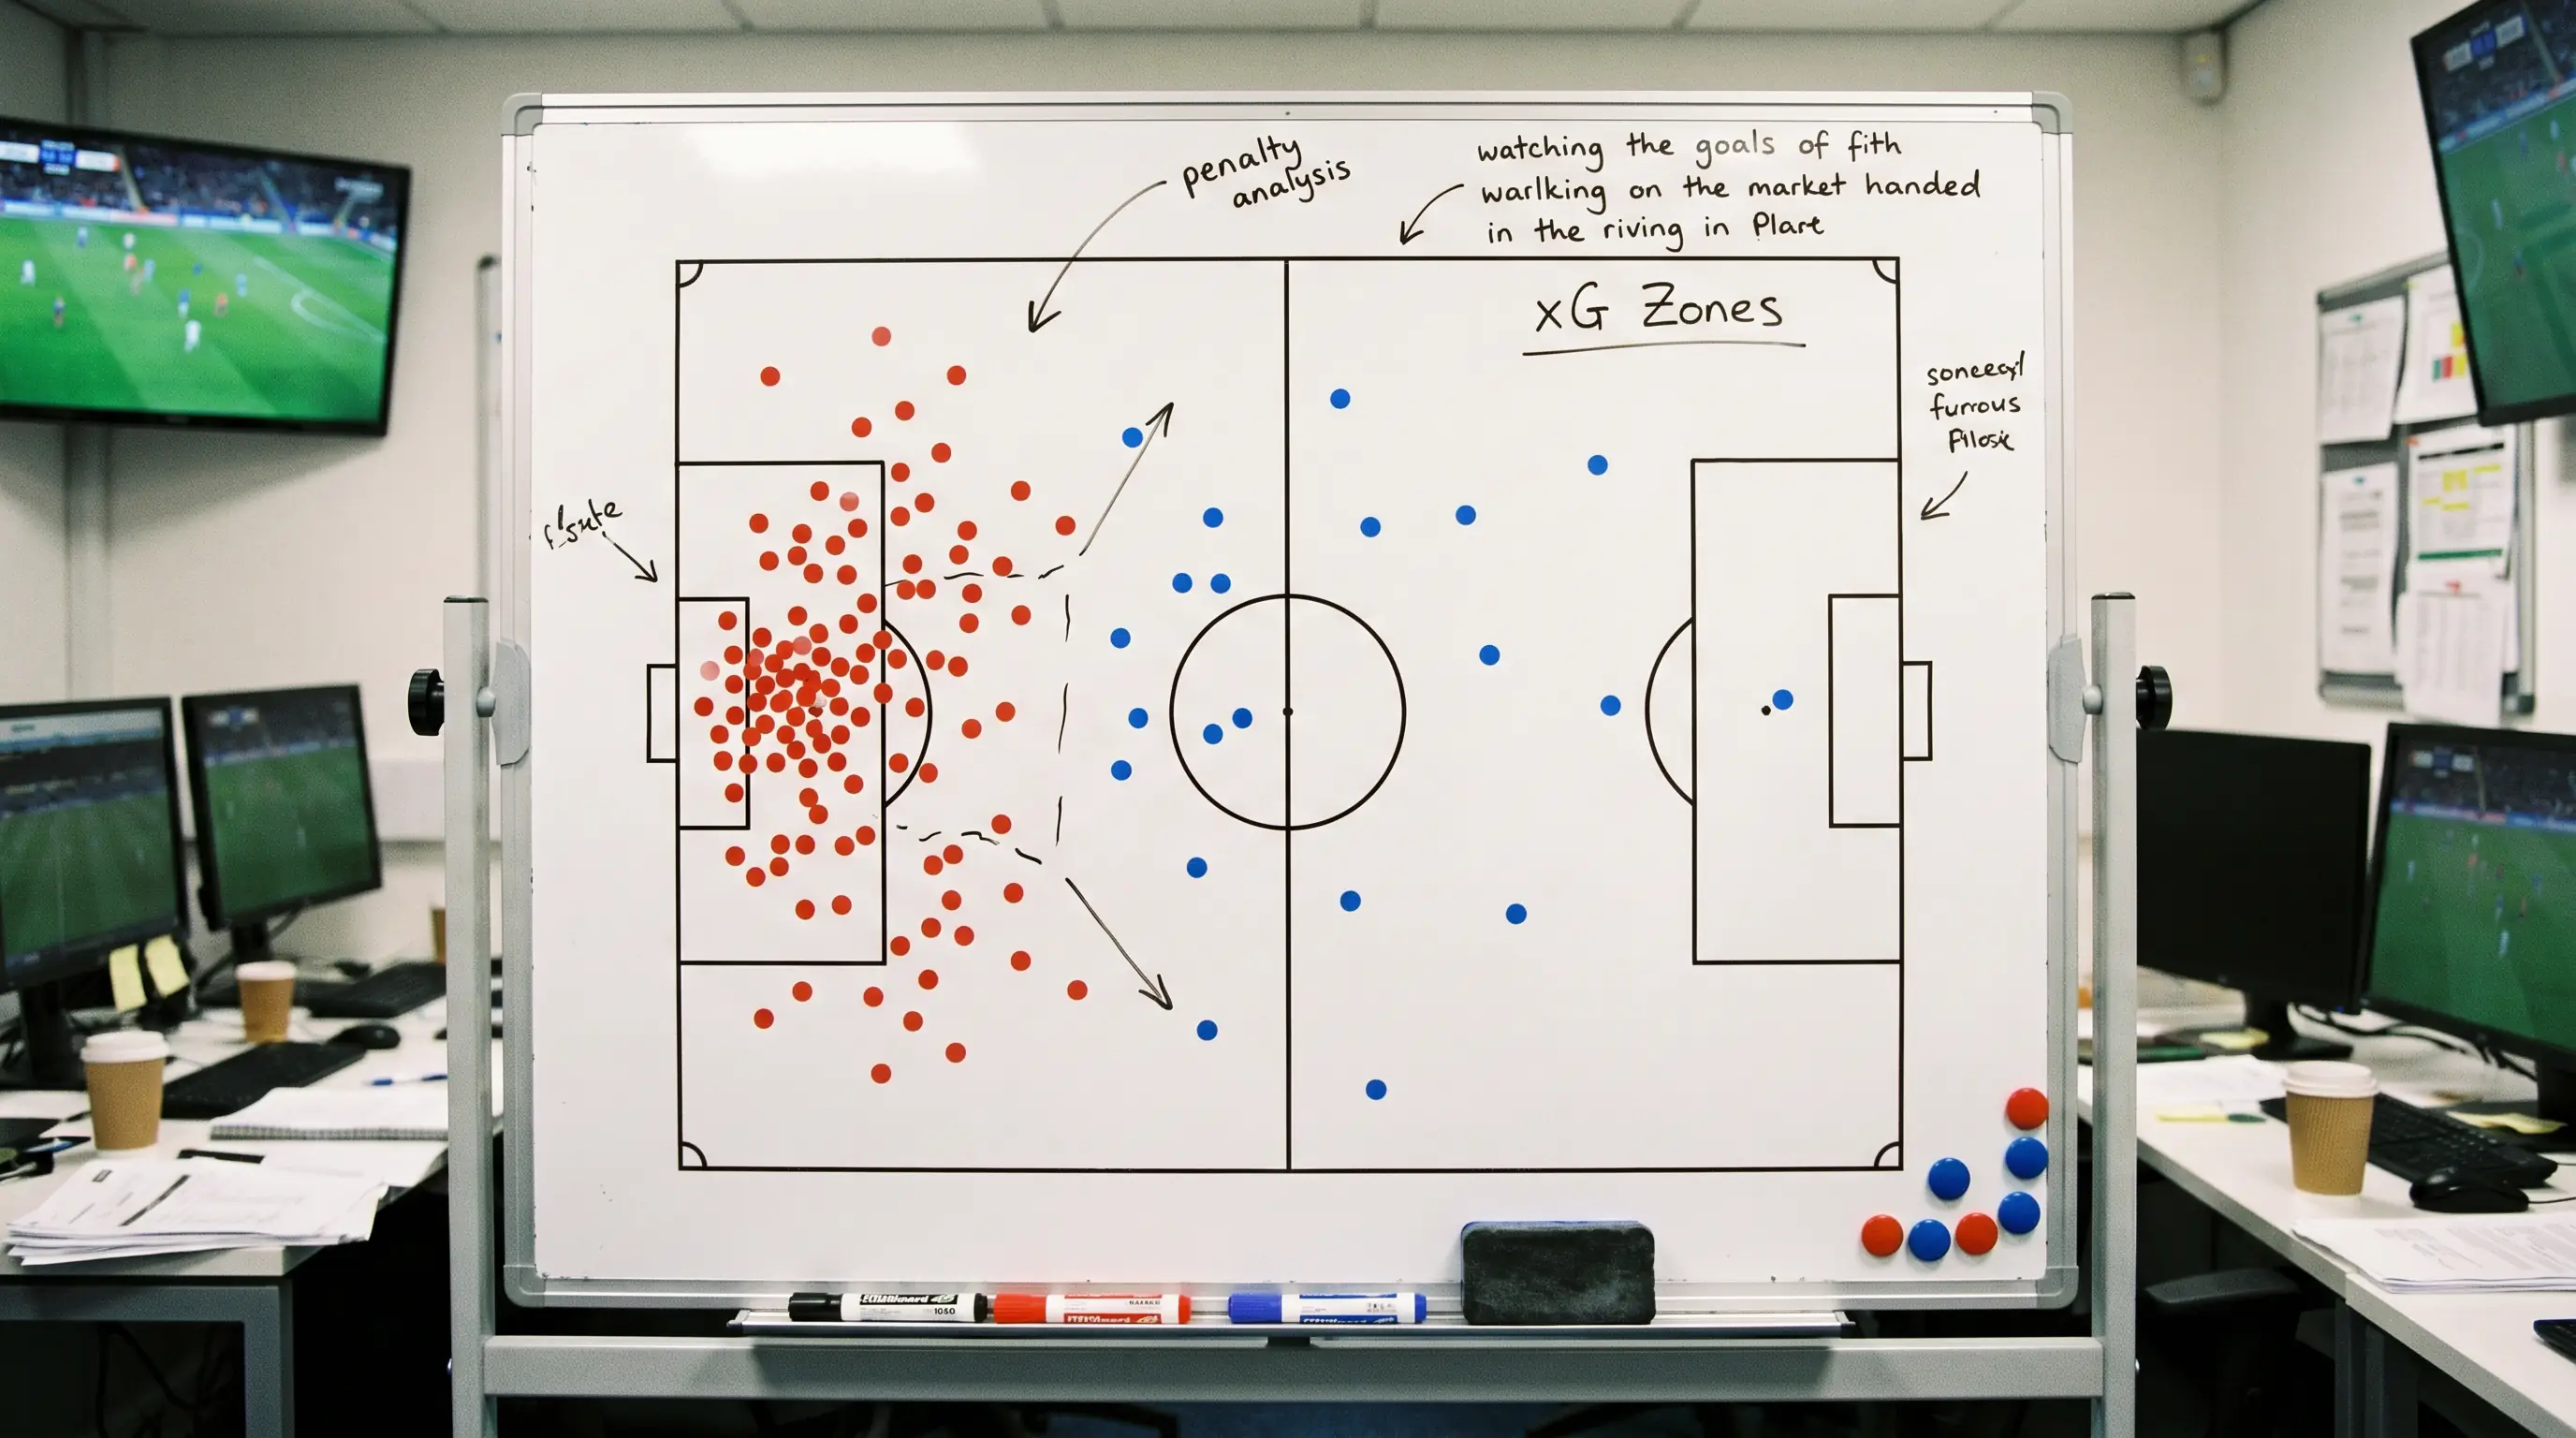
Layer three is shot data beyond xG. How many shots is the team taking? Where on the pitch are those shots coming from? Are they generating chances from open play or relying on set pieces and penalties? A team creating 15 shots per game with 6 inside the box is in much healthier shape than a team creating 15 shots with only 2 inside the box, even if the xG numbers are similar. Volume and location together tell you about process sustainability — whether the attacking output is likely to continue or whether it is propped up by a few fortunate sequences.
Layer four is schedule. I check what each team has played in the last fourteen days and what they have coming up in the next seven. A side that played a gruelling cup tie on Wednesday, flew back from Europe on Thursday, and faces a lunchtime kick-off on Saturday is not the same proposition as a team that had a full week on the training ground. Fatigue does not always show up in the result — a tired team can still grind out a 1-0 — but it consistently suppresses xG, reduces pressing intensity, and increases the likelihood of defensive errors. During the Christmas fixture pile-up, I adjust my form assessment heavily toward schedule awareness.

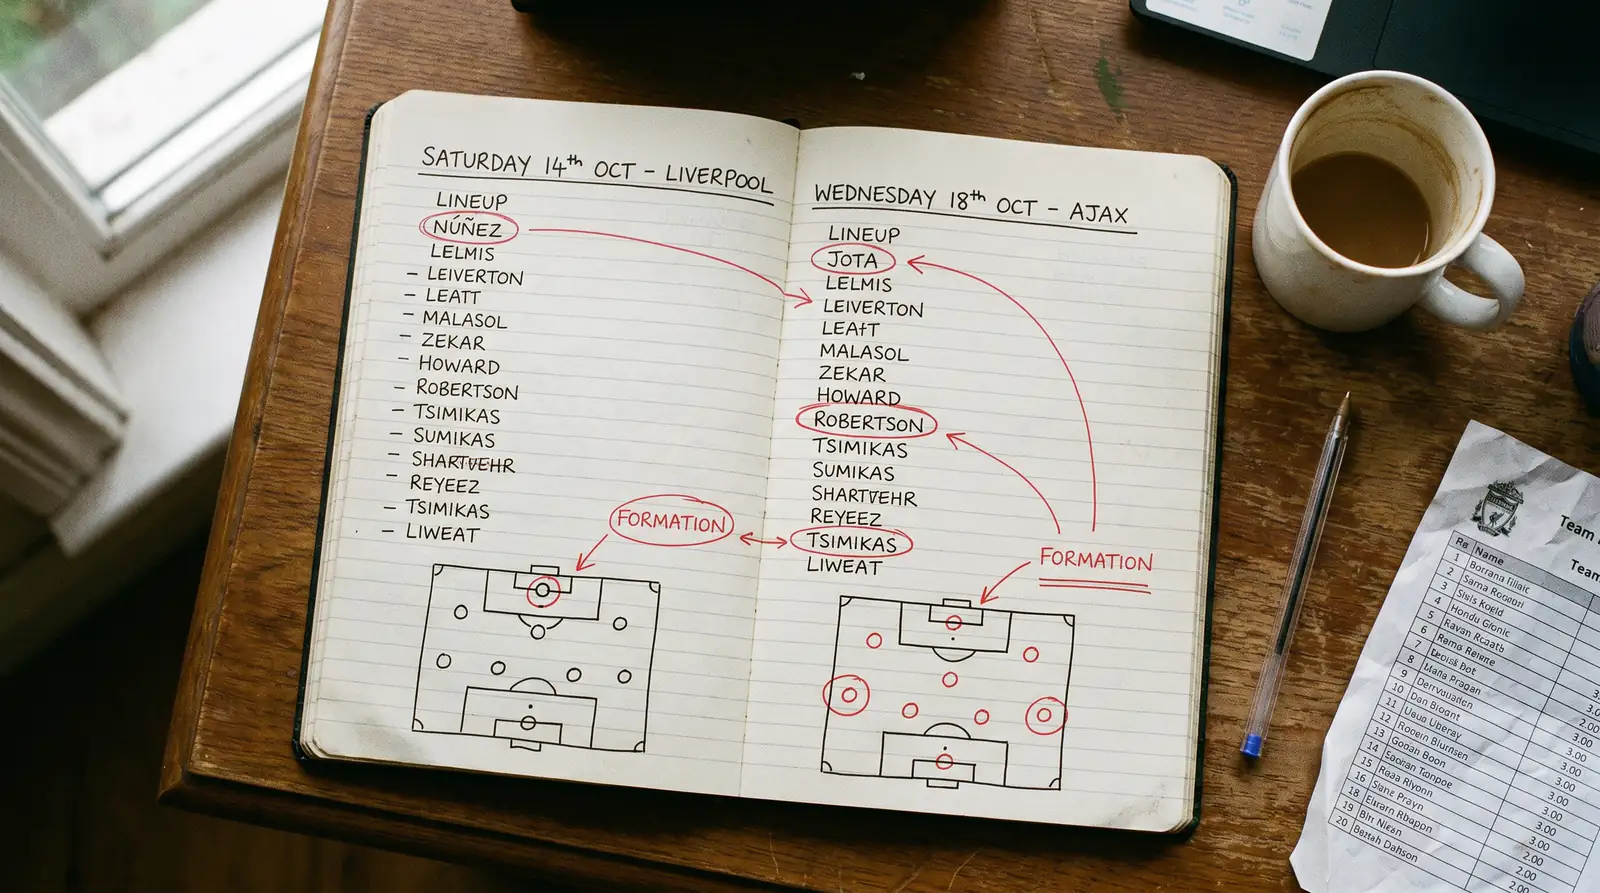
Layer five is squad rotation. Managers rotate more aggressively now than at any point in the last decade, and the difference between a first-choice eleven and a rotated side is often worth half a goal in expected terms. I track which players started each of the last five matches and flag fixtures where significant rotation is likely — cup-tie hangovers, European commitments, or managers who have publicly discussed managing workloads. A team’s form with their strongest eleven can be wildly different from their form with a second-string side, and lumping both into a single W-D-L string is a recipe for bad bets.
Head-to-Head Records: Useful Signal or Statistical Noise
Punters love head-to-head records. Every match preview in every newspaper leads with them. But I have an uncomfortable truth to share: most head-to-head records are statistical noise dressed up as meaningful data.

Andrew Rhodes, then the Chief Executive of the Gambling Commission, once commented on the danger of entrenched positions obscuring the actual point — and the same principle applies to H2H records. When people say “Arsenal have won eight of their last ten against this side,” they are treating a fixture as though it exists in a vacuum, independent of the squads, managers, and tactical contexts that have changed completely over those ten meetings. The Arsenal that beat a side 3-0 in 2019 shares a badge with the current team and precious little else.
There are narrow exceptions. Genuine ground-specific effects — tight pitches, artificial surfaces, hostile atmospheres at certain away grounds — can persist across seasons because the physical environment does not change with the squad. If a team has consistently struggled at a particular venue regardless of the personnel involved, that is worth noting. Similarly, tactical matchups between specific managers can produce patterns: a coach who consistently sets up to frustrate a rival’s style creates a repeatable dynamic that H2H records can capture.
My rule: I never use H2H as a primary betting factor. It is a tiebreaker at best — something I glance at after the five layers of form analysis have already pointed me toward a selection. If the form says bet and the H2H agrees, fine. If the form says bet and the H2H disagrees, I trust the form. And if the only reason to bet is the H2H, I do not bet at all.
For a complementary angle on reading match data, the xG betting strategy guide walks through how to turn these form observations into probability estimates that you can compare directly against the bookmaker’s prices.
How many recent matches should I look at for form analysis?
Six matches is the sweet spot for most purposes. Fewer than six and you are vulnerable to small-sample noise — a single freak result distorts the picture. More than ten and you are including data from a context that may no longer be relevant due to transfers, injuries, or tactical changes. I use a six-match rolling window for xG and shots data, and extend to ten matches only when checking for longer-term trends like home-and-away splits.
Does home-and-away form matter more than overall form?
Yes, significantly. Home and away form should be assessed separately because they reflect different tactical realities. A team averaging 1.9 xG at home and 1.1 xG away is not a 1.5 xG team — they are two different teams depending on the venue. I always split form by location and only merge the numbers when I am looking at a neutral-venue fixture like a cup final.
