

 Available in US
Content
What xG Measures — and What It Misses
Three seasons ago I lost money backing a side that won five of their first seven league games. The results looked brilliant. The xG told a different story: they had been outperformed in expected goals in six of those seven fixtures, scraping by on finishing luck and a goalkeeper having the run of his life. By November, the regression hit hard and they dropped like a stone. That was the season xG became the first thing I check, not the last.
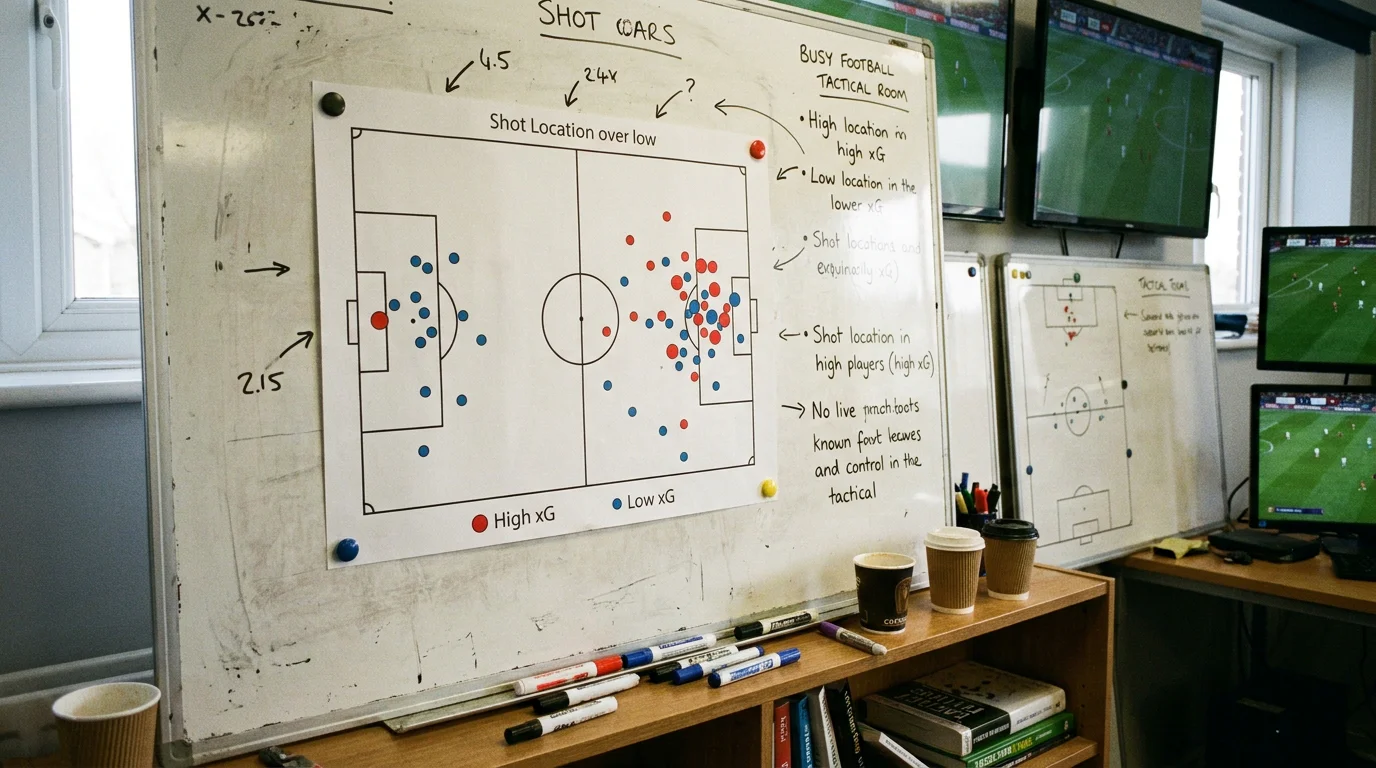
Expected goals assigns a probability to every shot based on historical data — the location, the angle, the body part used, whether it was from open play or a set piece. A penalty typically carries an xG of around 0.76. A header from six yards out might sit at 0.40. A long-range effort from 25 yards could be 0.03. Aggregate those values across a match and you get a picture of how many goals a team “should” have scored based on the quality of their chances.
Sascha Wilkens published a study in SAGE Journals analysing xG models across 11 Bundesliga seasons and found they could generate ROI of approximately 10% at average market odds, rising to around 15% when bettors shopped for the best price. That is a meaningful edge in a market where most punters are flat or negative over time. But — and this matters — xG is not magic. It does not account for individual finishing ability above or below the mean, it underweights goalkeeper quality, and it cannot capture tactical shifts within a match that the model was not trained to see. xG is a lens, not a crystal ball.
Translating xG Into Match Probabilities
Raw xG numbers are interesting but useless for betting until you convert them into probabilities. A team averaging 1.8 xG per game and conceding 1.2 xG per game tells you something about quality, but it does not directly answer the question the bookmaker is pricing: what is the probability of a home win, a draw, or an away win?
The bridge is simulation. Using each team’s attacking xG and defensive xG-against, you can model the likely number of goals each side scores in a given match. The simplest approach uses a Poisson distribution — feed in the expected goal rate for each team, run thousands of simulated matches, and count how often each result occurs. More sophisticated approaches adjust for opponent strength, home advantage, and recent form trends, but even a basic Poisson model built on six-match rolling xG averages produces probabilities that are competitive with the bookmaker’s opening lines.

Research from a systematic review of machine learning in sports betting found that models optimised for calibration generated 69.86% higher average profit compared with accuracy-optimised models. The practical implication is that you should not try to predict winners — you should try to predict probabilities accurately. If your model says a home win has a 48% chance and the bookmaker is pricing it at 42% implied probability, you have a potential value bet regardless of whether the home team actually wins that specific match.

I run my own simplified version of this process every Friday evening. I pull six-match rolling xG averages for both teams, adjust for home advantage by adding roughly 0.25 xG to the home side and subtracting 0.15 from the away side, then use an online Poisson calculator to generate match probabilities. The whole exercise takes about ten minutes per fixture. It is not a hedge fund model, but it consistently flags two or three bets per weekend where the bookmaker’s price looks generous relative to my estimates.

A Pre-Match xG Checklist for Weekend Fixtures
Knowing the theory is one thing. Applying it under the time pressure of a Saturday morning, with fifteen fixtures on the card and the early kick-off three hours away, is another. I built a checklist that keeps me disciplined and stops me from skipping steps when I am in a rush.
Step one: pull the six-match rolling xG-for and xG-against for both teams. I use whichever free stats provider updates fastest after the midweek round. If either team played in the last 72 hours, I flag potential fatigue and check whether the xG numbers in that recent match were suppressed by rotation.
Step two: compare my Poisson-derived probability for each outcome against the bookmaker’s implied probability. If the gap between my number and the bookmaker’s number is less than 5 percentage points, I pass — the margin of error in my model is too wide to claim genuine edge on a small discrepancy. If the gap exceeds 5 points, the fixture goes on the shortlist.
Step three: sanity-check the shortlisted fixtures against context that xG does not capture. Is a key player injured? Has the manager changed formation recently? Is there a derby or cup-tie hangover that might affect intensity? These qualitative factors can override the quantitative signal, and ignoring them is how model-reliant bettors get burned.
Step four: check the odds across multiple bookmakers. The Wilkens study found that the ROI gap between average odds and best available odds was roughly five percentage points. That is the difference between a profitable season and a losing one, and it costs nothing except two extra minutes of comparison. If the best price does not clear my break-even threshold, I do not bet.

Step five: record the bet with the pre-match xG estimates, the probability I assigned, the odds I took, and the stake. This record is what allows me to review the model’s calibration at the end of each month. If my 60% predictions are only landing 50% of the time, I know the model needs adjustment. If they are landing 62%, I know I am on track. Without the record, you are guessing about whether you are guessing well.

If you want to take this further and incorporate form analysis beyond xG alone, I have written a companion piece on reading football form beyond the win-draw-loss record that pairs well with this workflow.
Where can I find free xG data for English football?
Several websites publish match-level and team-level xG data for the Premier League and Championship at no cost. The most commonly used free sources update within 24 hours of each fixture and provide rolling averages, shot maps, and per-90-minute breakdowns. Look for sites that clearly state their xG model methodology — transparency about how the numbers are calculated is a good indicator of data quality.
Can xG alone make me profitable at football betting?
xG is a powerful input, but relying on it in isolation is risky. It does not capture goalkeeper quality, individual finishing talent above or below the mean, managerial tactical changes, or match context like motivation and fatigue. The most effective approach combines xG with form analysis, team news, and price comparison. Think of xG as the foundation of your analysis, not the entire building.
