

 Available in US
Content
Goals Are Half Skill, Half Chaos — the Data Helps You Pick Apart Which
I once backed the same striker to score anytime in seven consecutive matches. He was averaging a goal every 90 minutes, topping the league’s xG charts, and his price kept drifting because the market had not caught up to a recent run of form. He scored in five of the seven, I made a solid return, and I thought I had cracked the goalscorer market. The following month I applied the same logic to another in-form forward and he blanked in six straight starts. That was when I understood: goalscoring is partly predictable and partly chaotic, and the profitable bettor is the one who knows which part is which.
Football generates £1.1 billion in GGY from UK betting each year, and the goalscorer markets — anytime, first, and last — absorb a significant share of that. They are among the most popular bet types for recreational punters because they feel personal. You are not backing a team or a scoreline; you are backing a player. That emotional connection is exactly what the bookmaker exploits, pricing household names tighter than their data warrants while leaving less glamorous but statistically superior options at longer odds.
Shots, xG Per 90 and Penalty Duties: The Stats That Matter
When I assess a player for the anytime goalscorer market, I look at three data points before anything else.
First, shots per 90 minutes. This is the volume metric — how often does this player get into shooting positions? A striker averaging four shots per 90 has roughly twice as many opportunities as one averaging two, and over a season that volume difference is the single biggest predictor of who scores and who does not. I set a minimum threshold of 2.5 shots per 90 for any anytime goalscorer bet. Below that, the player is not getting into enough positions for the bet to have a reasonable chance of landing.
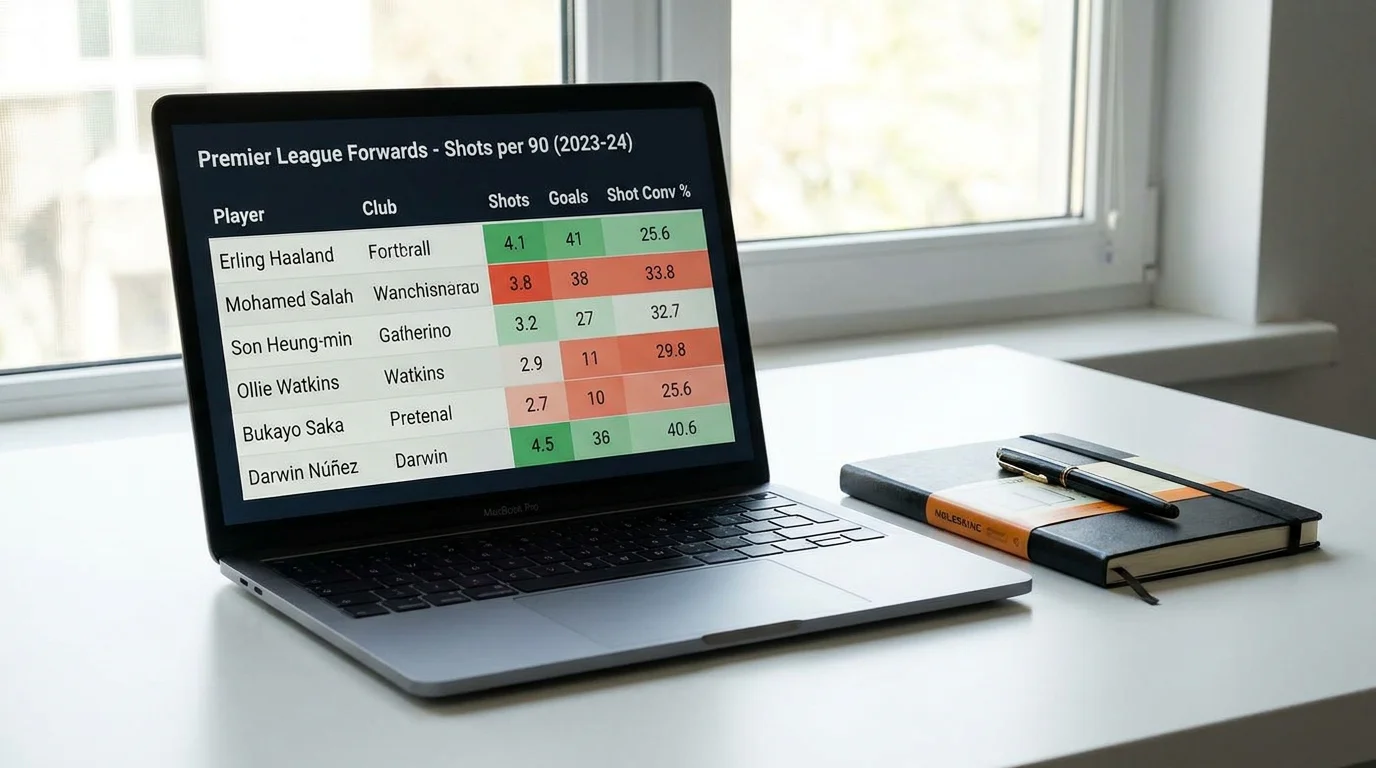
Second, xG per 90. This refines the volume metric by weighting shot quality. A player taking four shots per game from 25 yards has a much lower conversion expectation than one taking three shots from inside the six-yard box. xG captures this difference. An xG-based study across 11 Bundesliga seasons demonstrated that models using shot quality data could generate meaningful positive returns — roughly 10% ROI at average market odds. The same principle applies at the individual player level: xG per 90 tells you how many goals a player “should” score based on the chances he gets, regardless of whether he has been finishing above or below that rate recently.

Third, penalty duties. This is the most overlooked edge in the goalscorer market. A designated penalty taker adds approximately 0.07-0.10 xG per 90 to their total across a season, depending on how frequently their team wins penalties. That sounds small, but it translates to roughly four to six additional goals over a 38-game Premier League campaign. More importantly, penalties are high-conversion chances — around 76% conversion rate historically — which means the player gets a near-guaranteed goal opportunity several times a season on top of their open-play output. When I find a player whose odds do not appear to fully price in their penalty-taking role, that is often where the edge sits.

Beyond these three core metrics, I pay attention to the opposition defensive profile. A centre-forward facing a side that concedes 1.5+ xG per game from open play is in a fundamentally different situation from one facing a side conceding 0.8 xG. The bookmaker adjusts prices for opposition quality, but not always precisely — especially in midweek fixtures and lower-profile matches where the pricing algorithms rely more heavily on baseline data and less on matchup-specific adjustments.

First Goalscorer vs Anytime: When Each Offers Better Value
This distinction matters more than most punters realise, because the two markets price risk very differently.
First goalscorer pays more because it requires your player to score before anyone else. The probability of any specific player scoring first is roughly their share of the team’s total expected goals divided by the combined expected goals of both teams. For a prolific striker on a dominant side, first goalscorer probability might sit around 12-15%. For a midfielder who chips in with six goals a season, it could be 3-5%. The odds reflect these probabilities — but with a heavier margin than the anytime market, because the outcome space is larger.
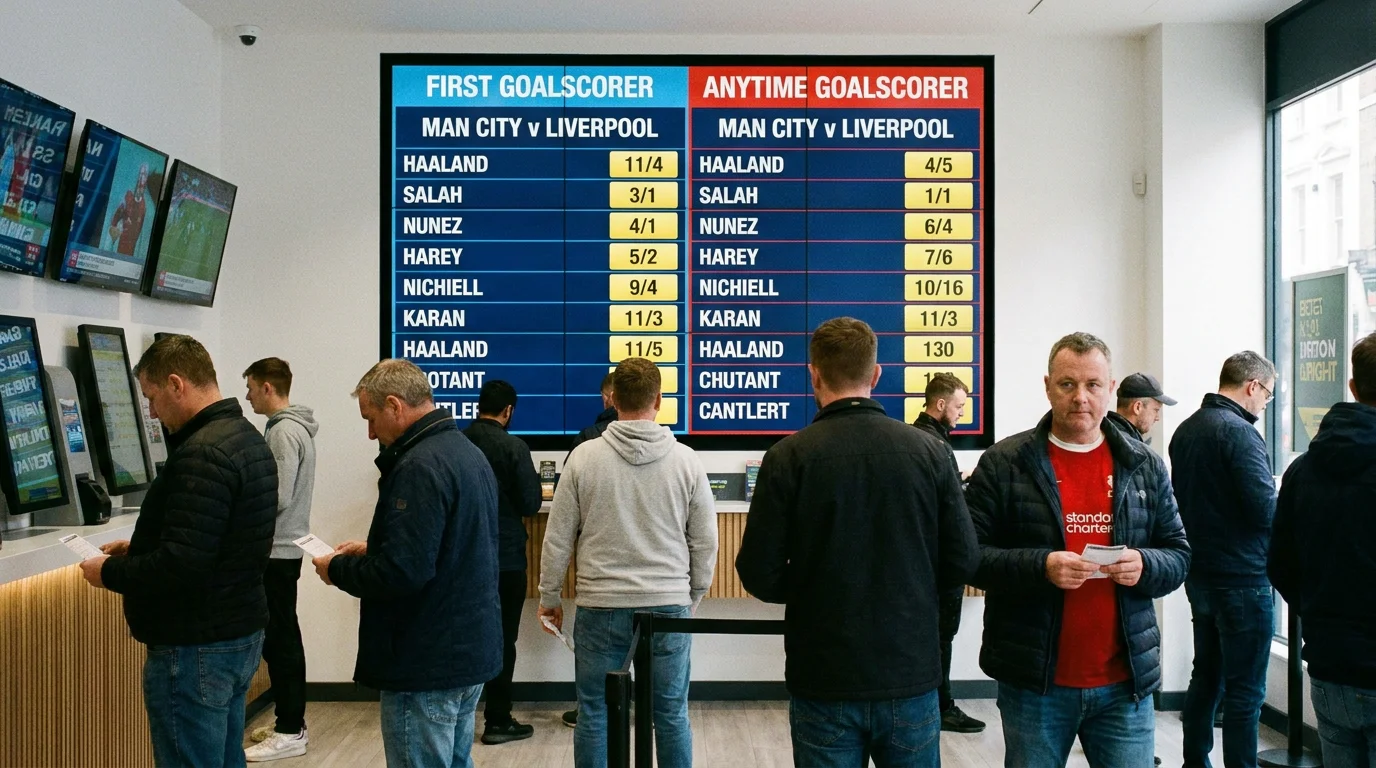
Anytime goalscorer is simpler: your player just needs to score at any point. The probability is higher, the odds are lower, and the margin tends to be tighter on the most popular selections. For the same prolific striker, anytime probability might be 35-45% depending on the fixture — nearly three times the first goalscorer probability.
My rule of thumb: I default to anytime unless a specific edge exists in the first goalscorer market. That edge usually comes from one of two situations. The first is when a team scores early consistently — some sides are habitual fast starters, and their main striker benefits disproportionately from that pattern. If a team has scored in the first fifteen minutes in eight of their last twelve matches, the first goalscorer market underprices the forwards in that setup. The second situation is when the first goalscorer price on a specific player is significantly out of line with the anytime price. If the implied probability gap between first and anytime is larger than you would expect based on the team’s early-goal tendencies, the first goalscorer price may contain extra value.
One trap to avoid: backing defenders or goalkeepers at long odds in the first goalscorer market because “the odds are great.” The odds are great because the probability is minuscule. A centre-back might score three goals in a season, almost all from set pieces. The first goalscorer price of 25/1 or 33/1 looks tempting, but the implied probability is typically accurate or even generous to the bookmaker. You are not finding value — you are buying a lottery ticket with a known negative expected value.
If you want to incorporate goalscorer selections into multi-leg bets, the bet builder strategy guide explains how to check correlation between legs and avoid compounding the bookmaker’s margin.
Is anytime goalscorer better value than first goalscorer?
In most cases, yes. Anytime goalscorer markets tend to carry tighter margins and the higher base probability means your analysis faces less noise. First goalscorer can offer value in specific situations — teams that score early or players whose first goalscorer price is disproportionately high relative to their anytime price — but as a default market for goalscorer bets, anytime is the more consistent option.
How do I factor in penalty-taking duties for goalscorer bets?
Check who takes penalties for each team before any goalscorer bet. A designated penalty taker adds roughly 4-6 extra goals over a full Premier League season, which materially increases their anytime goalscorer probability. If a player has recently taken over penalty duties due to a squad change or injury to the previous taker, the bookmaker’s odds may not yet fully reflect this — that lag is where the edge often sits.
